How to configure alerts in Endpoint Manager
Click 'Configuration Profiles' > 'Alerts'
- The alerts section contains templates that determine the behavior of alerts when an event occurs. Each template lets you choose who receives the alerts and whether you want to create a service desk ticket from the alert.
- The alerts themselves are generated in response to procedures, monitors and discovery scans that you create. For example, you can create a monitor to track CPU usage on an endpoint and alert you if CPU usage exceeds 90%.
- In the standard workflow, all procedures, monitors, and discovery scan tasks have the 'Default Alert' template applied to them.
- Click 'Configuration Templates' > 'Alerts' > 'Default Alert' to view these settings.
- Click 'Configuration Templates' > 'Alerts' > 'Default Alert' to view these settings.
- If you want different alert settings for a specific event then you must create a new alert template. You can apply the alert template to the procedure, monitor or discovery scan as required.
- You can have multiple templates to address different types of events. For example, you might want the alert for a failed patch to be different from the alert for a system restart.
- Alert templates can also be temporarily disabled or 'turned off'. EM does not trigger alerts for events related to procedures, monitors or discovery scans in which the template is used.
- This article explains how to create and manage alert templates.
Use the following links to jump to the task you need help with:
- Login to Comodo One/ Dragon
- Click 'Applications' > 'Endpoint Manager'
- Click 'Configuration Templates' > 'Alerts'

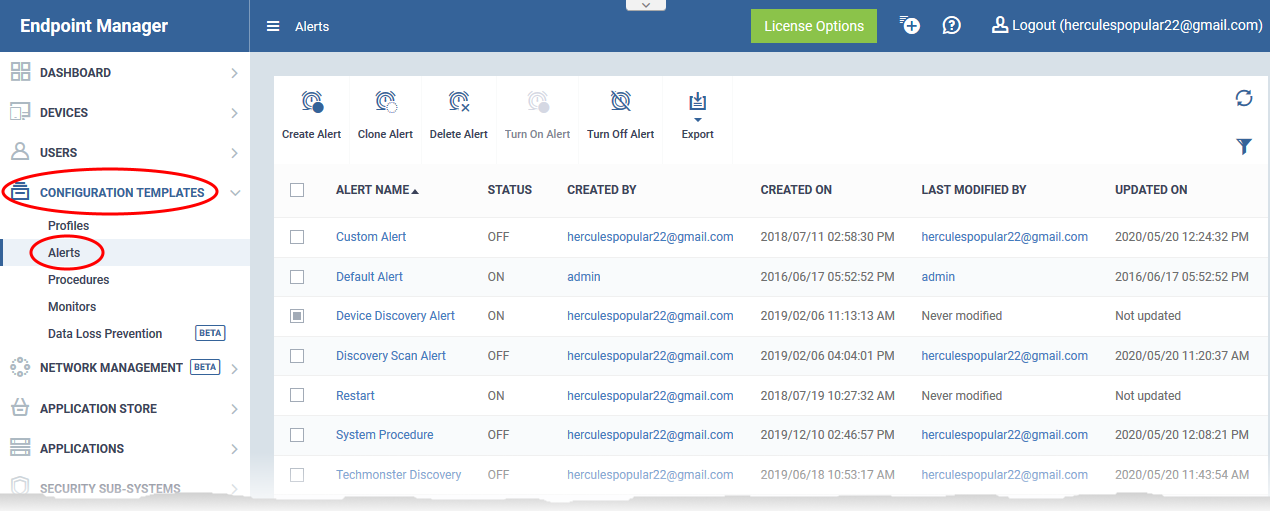
The screen lists all alert templates added to your account. You can add new templates, edit templates, create a new template by cloning an existing template, enable/disable alerts and more.
Alert Name - Label of the alert.
- Click the alert name to open the alert configuration interface. Click here for more details.
Status – Whether the alert is enabled or disabled
Created by - The administrator who created the alert.
- Click the name of an administrator to view their user details.
Created on - The date and time at which the alert was created.
Last Modified by - The administrator who recently edited the alert.
- Click the name of an administrator to view their user details.
Updated on - The date and time at which the alert was last updated.
- Click 'Configuration Templates' > 'Alerts'
- Click 'Create Alert'

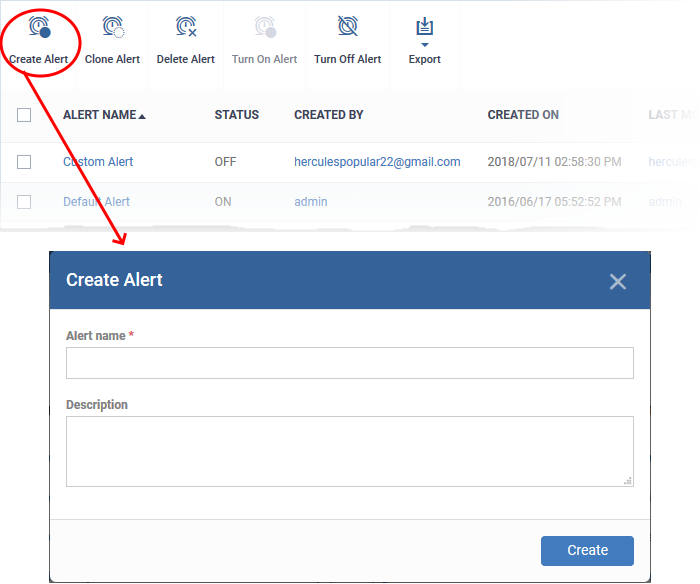
- Enter a name and description for your alert then click 'Create'
- After saving, you will be taken to the alert configuration screen.

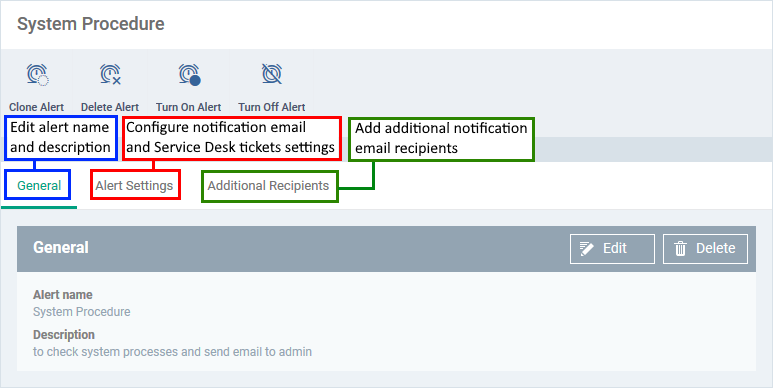
- Click 'Edit' on the right to configure alert settings. Click the following links if you need help with a particular tab:

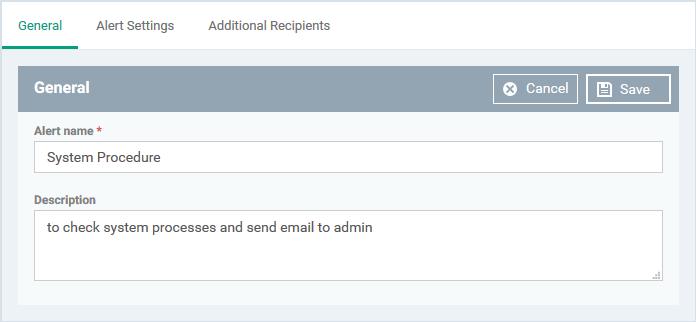
- Name - This is pre-populated with the label you created in the previous step. Edit the name, if required.
- Description - This is pre-populated with the note you entered in the previous step. Edit the description if required.

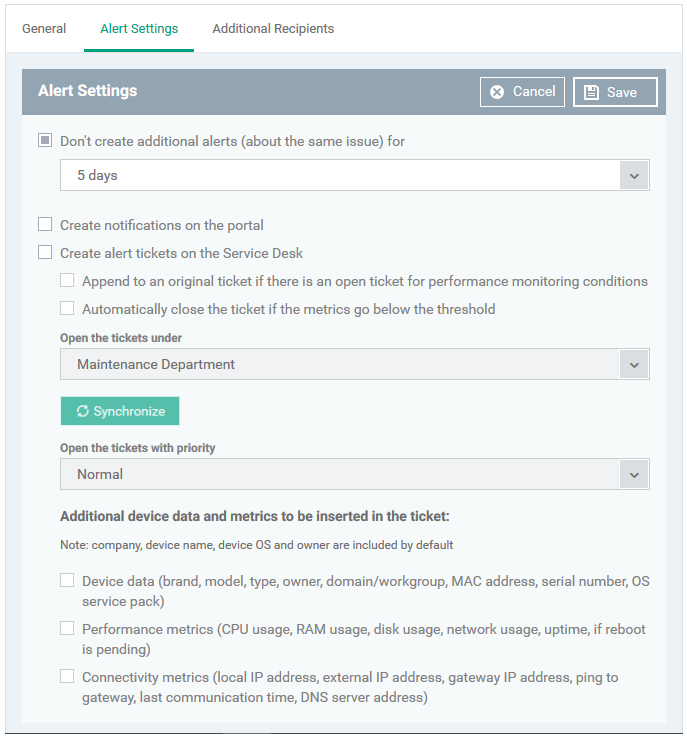
- Don't create additional alerts (about the same issue) for - Determines how long EM should wait before creating a repeating alert for the same issue. Use the drop-down to choose the time period.
- Create notifications on the portal - If enabled, the alert is also shown in the 'Notifications' screen of Endpoint Manager. Click 'Dashboard' > 'Notifications' to view these alerts.
- Create alert tickets on the Service Desk - If enabled, a ticket is auto-created in Service Desk for the alert. The ticket contains the alert text and is assigned to the department you choose.
- Append to an original ticket if there is an open ticket for performance monitoring conditions - Adds the alert to an existing ticket if one exists. If disabled, a new ticket is always created.
- Automatically close the ticket if the metrics go below the threshold - If enabled, will auto-close the Service Desk ticket if the issue gets resolved. For example, if the ticket was created because CPU usage went above 90%, it will auto-close should usage fall below 90%.
- Open the tickets under - Select the department to which the ticket should be assigned.
- The drop-down shows all departments in Service Desk.
- Click the 'Synchronize' button to import any new departments created in Service Desk
- The drop-down shows all departments in Service Desk.
- Open the tickets with priority - Select the ticket priority - normal, high or critical.
- Additional device data and metrics to be inserted in the ticket - By default, the name of the company, device type, device OS and the device owner are mentioned in the ticket.
You can add the following information:
- Device Data - Information like brand, model. IP address and so on
- Performance Metrics - Information about device CPU usage, RAM usage, disk usage, network usage and more
- Connectivity Metrics - Information on the network to which the device is connected, like local IP address, external IP address, gateway IP address and more
- Device Data - Information like brand, model. IP address and so on
Click 'Save'
- Configure to whom the notification is sent:

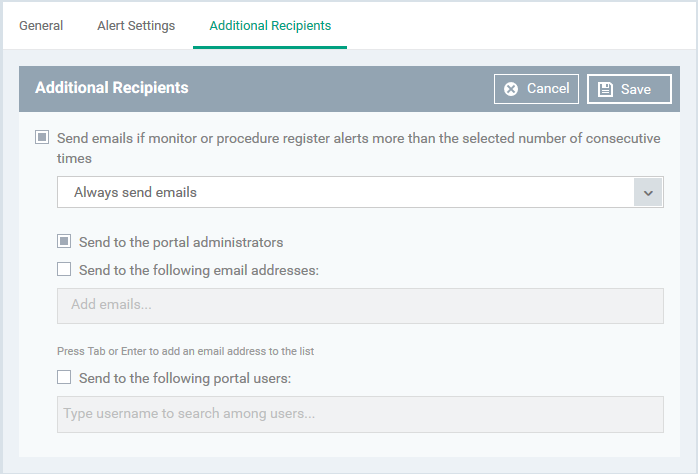
- Send e-mails if Monitoring or Procedure register alerts more than the selected number of consecutive times - Determines when email alerts should be sent for an issue. For example, if you select 5 from the drop-down, emails are only sent only if the same issue occurs 5 times.
- Send to the portal administrators - Emails alerts are sent to users with 'Administrative' roles.
- Send to the following e-mail addresses - Add external recipients. Enter the email address and press either 'Tab' or 'Enter' button. You can add multiple recipients.
- Send to the following portal users - Add users with 'User' roles. Type the username fully or partly and select from the list. You can add multiple users.
- Send to the portal administrators - Emails alerts are sent to users with 'Administrative' roles.
Click 'Save' to save the alert template.
You can now add the alert template to a procedure, monitor or a network discovery scan.
- See this page for help to create procedures
- See this page for help to create monitors
- See this page for help to create discovery scans
- Alerts can be selectively turned off, if you want EM not to generate notifications or Service Desk tickets for events related to procedures, monitors or discovery tasks in which they are used.
- You can turn-on a disabled alert at anytime.
- The 'Default Alert' that ships with EM cannot be disabled.
Disable an alert
- Click 'Configuration Templates' > 'Alerts'
- Select the alerts you want to disable
- Click the 'Turn Off Alert' button at the top

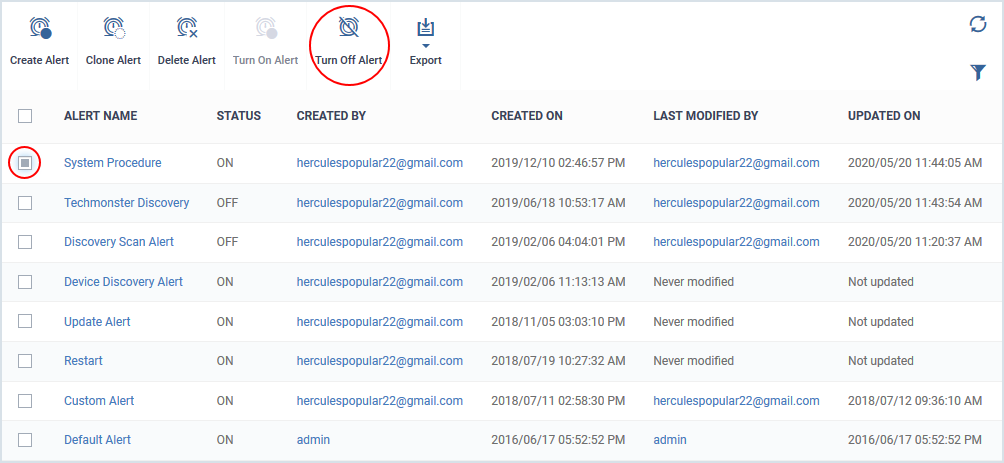
- Alternatively, click the name of an alert to open its alert details interface and click 'Turn Off Alert' at the top.
The alert is disabled. EM does not generate notifications, notification emails or Service Desk tickets for:
- When a procedure is run or failed, if the alert is used in the procedure
- Events where monitored conditions were met, if the alert is used in a monitor
- When a discovery scan is completed or failed, if the alert is used in a network discovery scan task
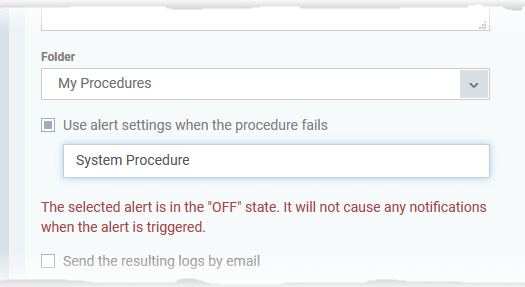
Also, EM notifies you if you select a disabled alert for alert settings when creating/editing a procedure, monitor or a discovery scan task. An example is shown below:

Enable an alert
- Click 'Configuration Templates' > 'Alerts'
- Select the alerts in 'OFF' state, that you want to enable
- Click the 'Turn On Alert' button at the top

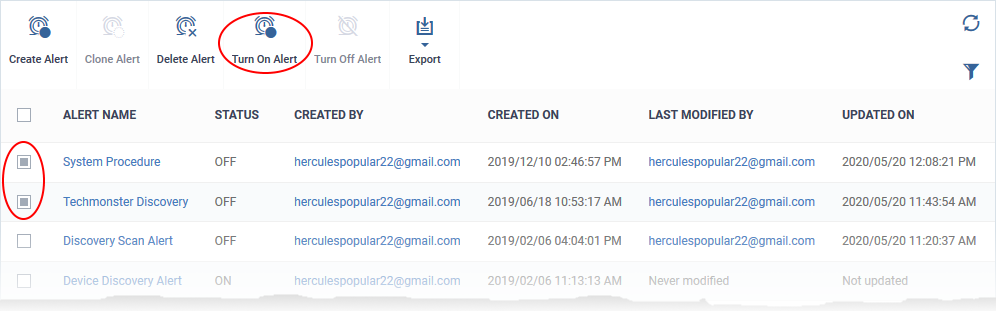
- Alternatively, click the name of a disabled alert to open its alert details interface and click 'Turn On Alert' at the top.
The alert starts generating notifications, notification emails and Service Desk tickets as configured in it, if the corresponding events occur.


---