North America
How to create an automated alert ticket in Service desk using ‘Monitoring’
Views
2918 times
- Monitors track events on a managed endpoint and take specific actions if their conditions are met. For example, you could create a monitor to alert you if disk space on a device falls below 10%.
- You can also configure a monitor to create a Service Desk ticket if its condition are met.
- You add the monitor to a profile. The profile is, in-turn, deployed to devices to implement the monitor.
- This tutorial will take you through the following:
- Create an alert template which generates Service Desk tickets
- Create your monitor and apply the alert template
- Add the monitor to a profile
- Create an alert template which generates Service Desk tickets
Create an alert template
- Login to Xcitium
- Click 'Applications' > 'Endpoint Manager'
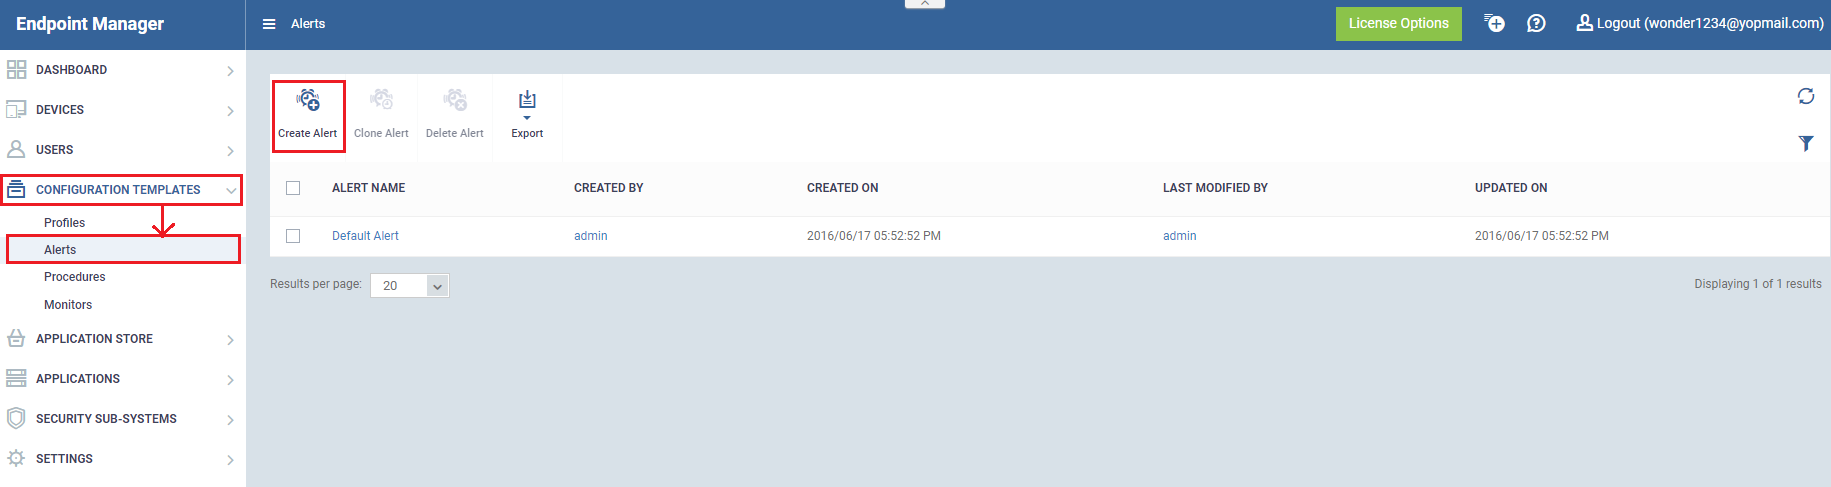
- Click 'Configuration Templates' > 'Alerts'
- The 'Alerts' interface shows all existing alert templates. These templates contain the responses you want taken if the conditions of a monitor are met.
- You can apply the same alert template to several monitors, or create different templates for different monitors as required.
- Click 'Create Alert':

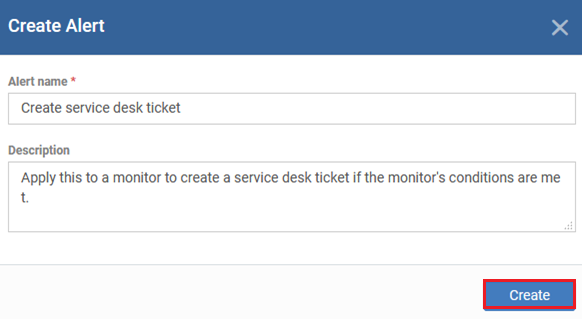
- Type a name and description for your alert then click 'Create':

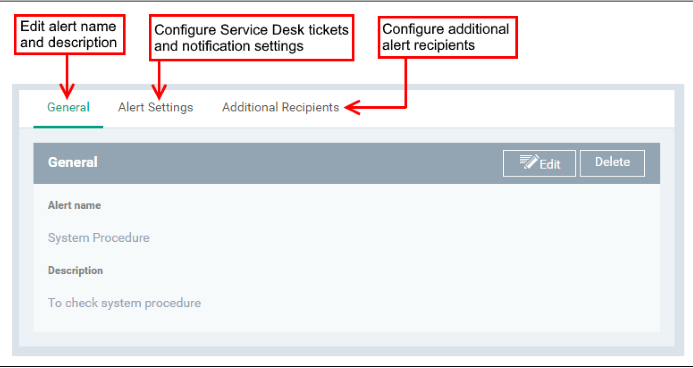
- After saving, you will be taken to the alert configuration screen:

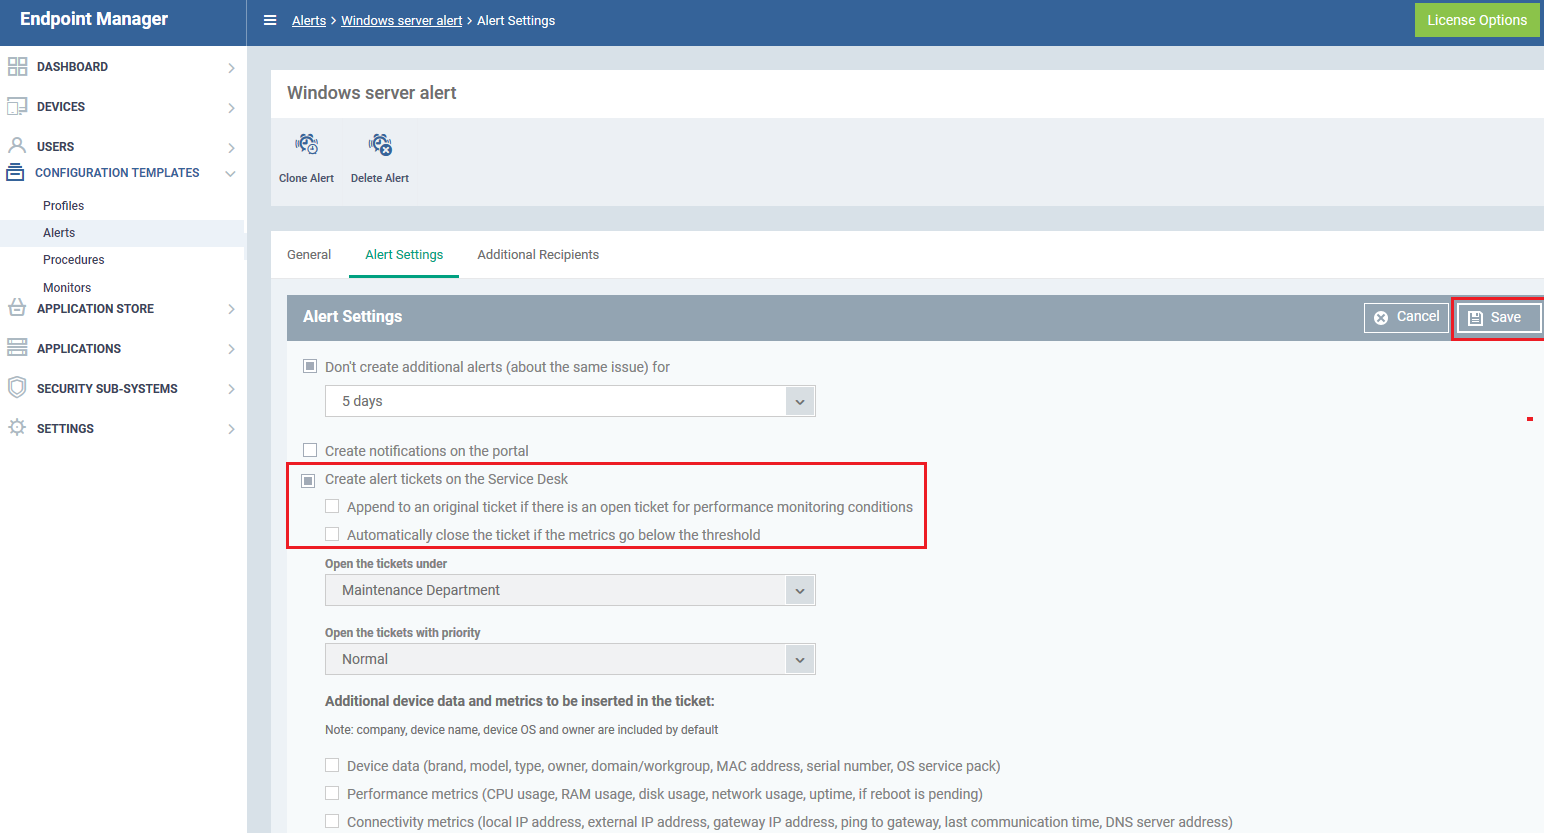
- Click the 'Alert Settings' tab

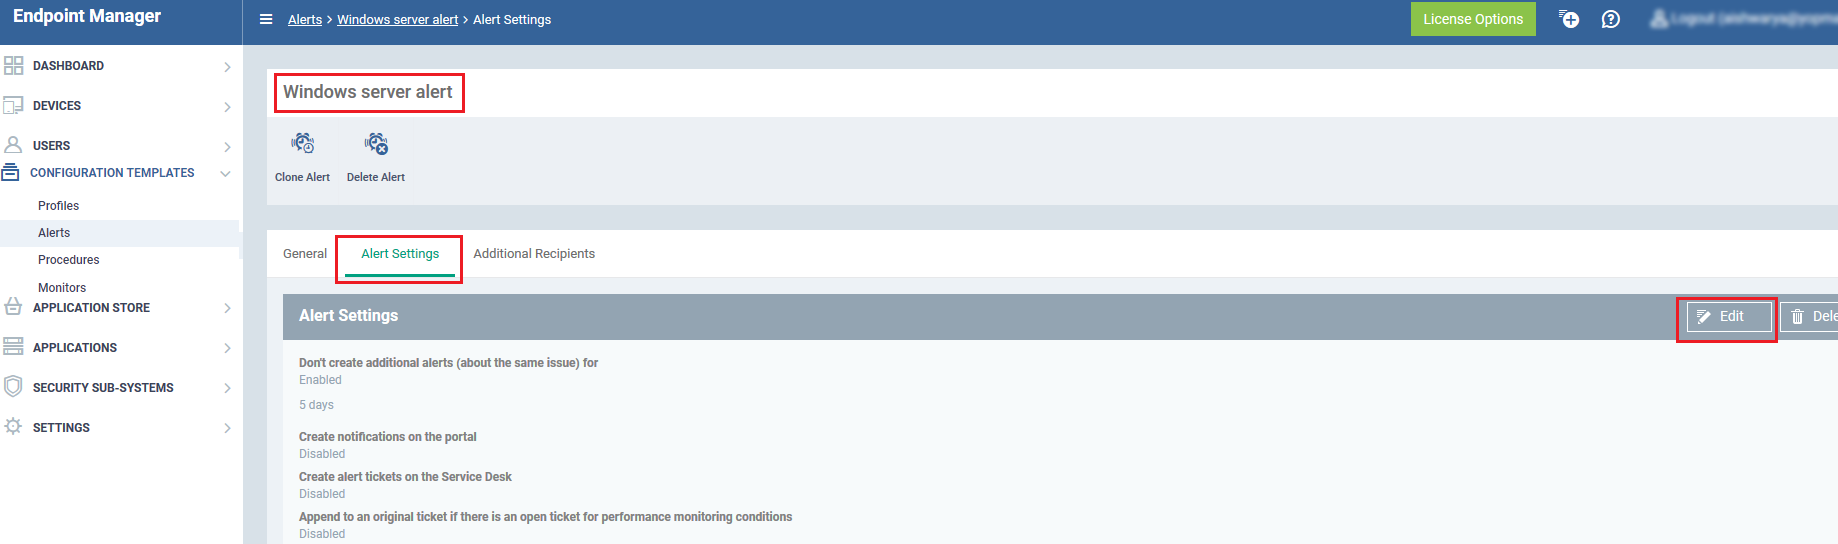
- Click 'Edit' and configure the following settings:
- Enable “Create alert tickets on the Service Desk''
- 'Append to an original ticket if...' - If enabled, the monitoring breach data will be added to an existing ticket if one already exists for the breach. If unselected, a new ticket is created for each breach.
- 'Automatically close the ticket if the metrics...' - If enabled, the ticket is closed if/when the monitored conditions return to normal.
- 'Open the tickets under' - Select the department to which the ticket should be assigned.
- 'Open the tickets with priority' - Select the ticket severity level from normal, high or critical. The severity level depends on the importance you place on the monitored condition.
- Enable “Create alert tickets on the Service Desk''
- Configure other alert settings as required, including extra recipients and additional data you want to include in the ticket.
- Click 'Save'. The new alert template will be listed in the alerts interface. You can now apply this template to your monitor.

Configure your monitor:
-
Click 'Configuration Templates' > 'Monitors'
- Click 'Create Monitor'

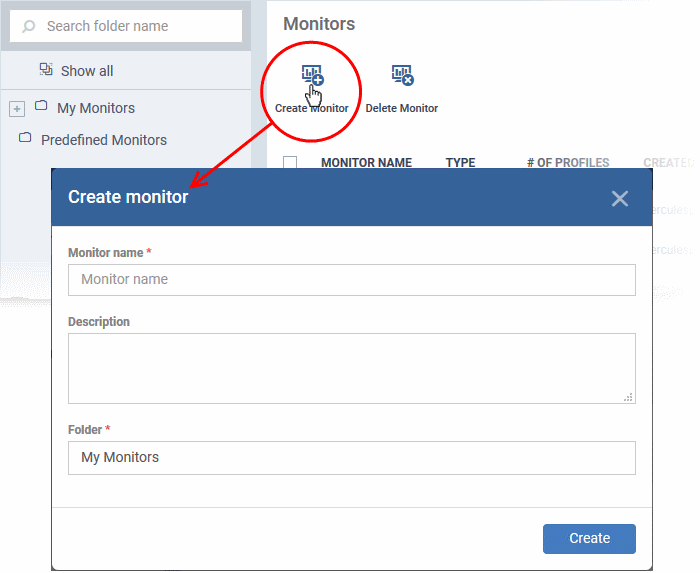
- Enter a label and description and specify where to save the new monitor. You can create new sub-folders under 'My Monitors' if required.
- Click 'Create'.
- You will be taken to the monitor configuration screen:

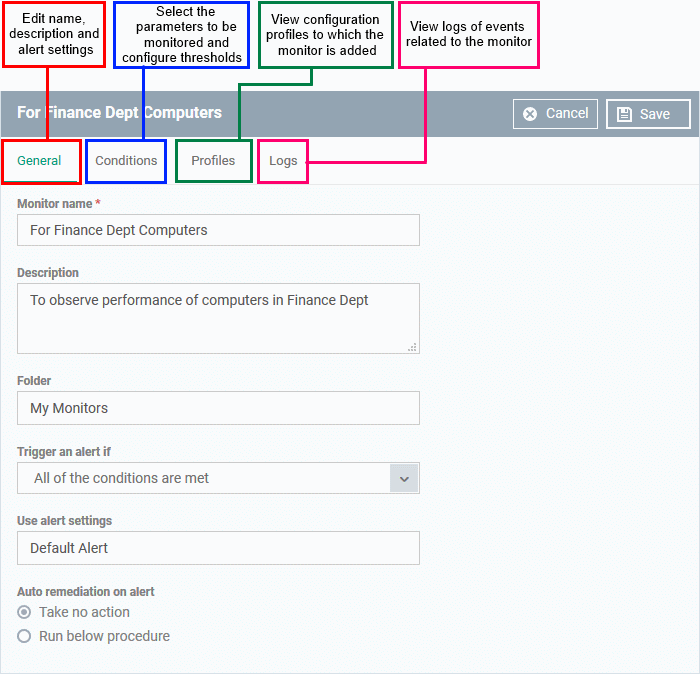
- Click the 'Conditions' tab
- Choose the event type that you want to monitor:

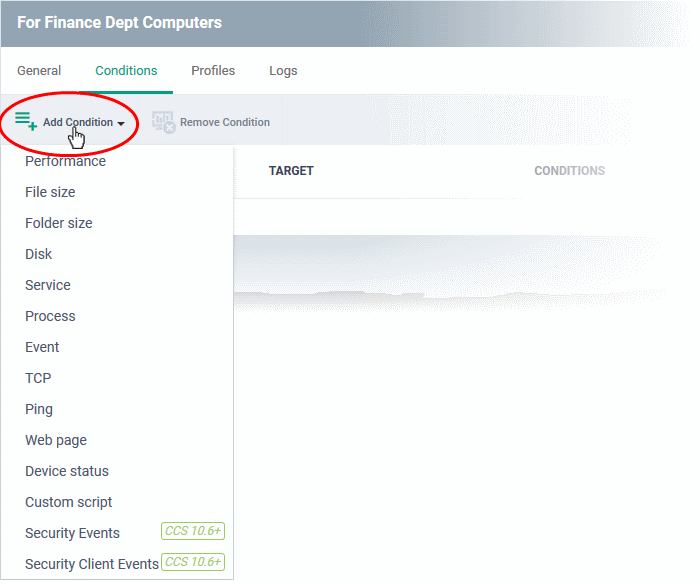
- Configure the conditions of the monitor. The example below shows the configuration screen for the disk space monitor:

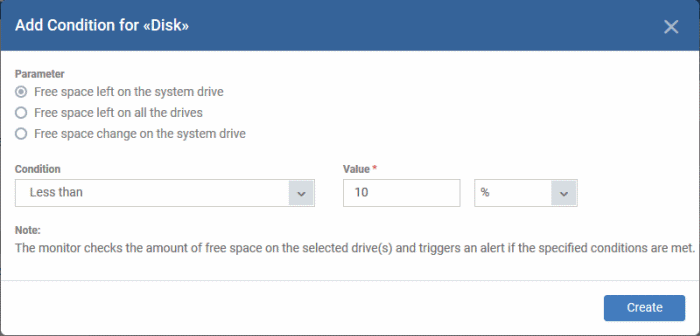
- Click 'Save'.
- The custom monitor will be added to the list of monitors under the 'Monitors' tab.
- The monitor can now be added to a profile which is deployed to your devices.
More details on monitors and alerts can be found at https://help.xcitium.com/topic-399-1-786-12967-Create-Monitors-and-Add-them-to-Profiles.html
Add the monitor to a profile
- Click 'Configuration Templates' > 'Profiles'
- Open the Windows profile you want to configure
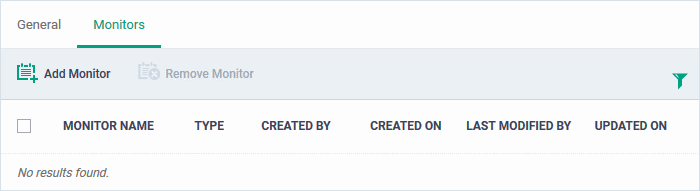
- Click 'Add Profile Section' > 'Monitors'
- Click the 'Add Monitor' button

- Type the name of the monitor you just created in the field provided:

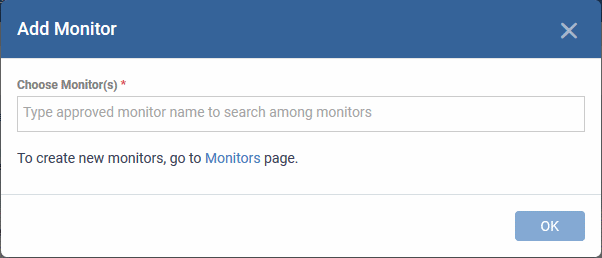
- Click 'OK' to save your settings
- The monitor will be listed in the 'Monitors' tab of the profile:

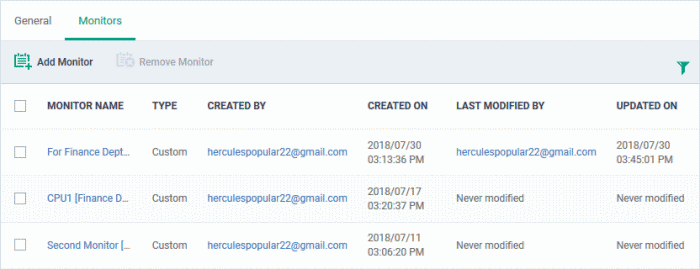
- The monitor will be applied to whichever endpoints are targeted by your profile on next sync.


CONTACT US
Call now!  (973) 859 4000 ext 3025
---