How to use network monitors to track SNMP devices
Click ‘Applications’ > ‘Endpoint Manager’ > ‘Network Management’ > ‘Monitors’
- A network monitor is a script that tracks events on SNMP compliant devices that don't run a supported operating system (Windows, Linux, iOS etc). Example devices include routers, switches and printers.
- For example, you could create a monitor to alert you if a router is switched off for a certain length of time. You can create custom monitors to track items of your choice.
- You add the monitor to a network profile which is in-turn applied to the device. A single monitor can be used in multiple profiles, and a single profile can include any number of monitors.
This article explains how to create a monitor, add it to a profile, and view monitor logs.
- Prerequisites
- Create a network monitor
- Create a network profile and add monitors
- Apply profile to devices
- View monitor logs
- You should already have run a discovery scan on the network to identify your SNMP devices. Click ‘Network Management’ > ‘Discoveries’ > ‘Create Discovery’.
- Make sure to activate ‘Enable SNMP for discovery’ when creating the scan.
- Once discovered, you then need to bring the devices under EM management.
- Click ‘Network Management’ > ‘Devices’ > ‘Discovered Devices’ tab.
- Select all SNMP devices in the list.
- Click the ‘Manage device over SNMP’ button.
- Click ‘Network Management’ > ‘Devices’ > ‘Discovered Devices’ tab.
- See this wiki if you need more help to create discovery scans and manage SNMP devices.
- Login to Xcitium
- Click 'Applications' > 'Endpoint Manager'
- Click 'Network Management' > 'Monitors'
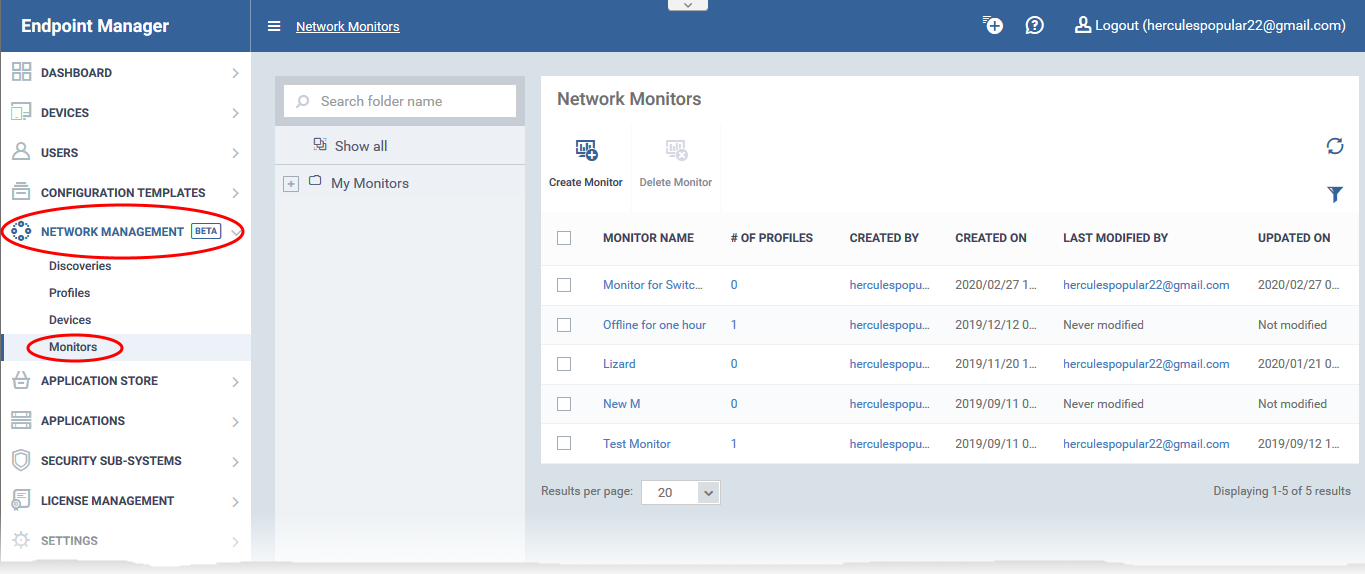
- The middle column shows the monitor folder tree. Each folder can house multiple monitors.
- The right-hand pane shows the monitors in the selected folder
- You can create your own sub-folders under 'My Monitors' if required.
Create a new monitor
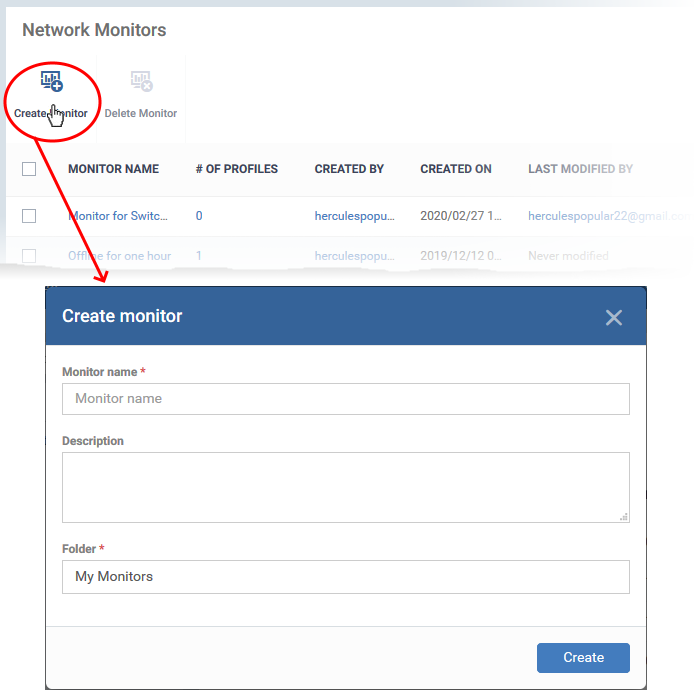
- Click 'Create Monitor'
- Enter a label and description for the monitor.
- Specify where to save the new monitor. You can create new sub-folders under 'My Monitors' if required.
- Click 'Create'.
- This opens the monitor configuration screen:


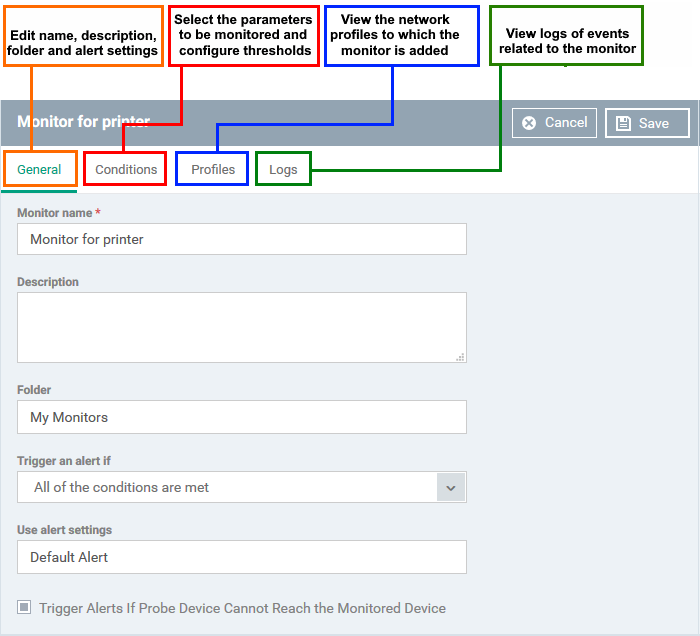
General Settings
Modify the following settings if required:
Trigger an alert if - Select when admins should receive an alert. The options are (i) when all monitored conditions are met, or (ii) when any monitored condition is met.
Use Alert Settings - Choose the alert template. The alert template is a collection of settings which determine additional recipients and other settings.
- The ‘Default Alert’ template is a good starting point. It sends email alerts to admins and creates notifications in the portal itself.
- You can configure your own alert template at 'Configuration Templates' > 'Alerts'.
- See this wiki if you want more help to configure an alert template.
Trigger Alerts If Probe Device Cannot Reach the Monitored Device - Endpoint Manager identifies the SNMP devices on your network by running a discovery scan. This scan is run from a ‘probe’ device - a managed Windows endpoint inside the target network. This setting alerts you if the probe device cannot communicate with the target SNMP device.
Choose what to monitor
- Click the 'Conditions' tab
- Click 'Add Condition'

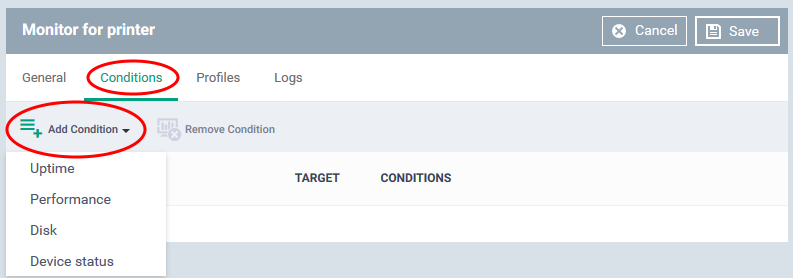
Choose the item you want to monitor:
- Uptime - Checks whether the monitored device is continuously online for a certain length of time
- Performance - Checks CPU, RAM and network usage. You are alerted if usage goes above (or below) a certain threshold.
- Disk - Checks free disk space, or for large changes to free disk space in short periods.
Triggers an alert if disk space falls below a certain level, or if there are large alterations to disk space in a short time.
- Device Status - Checks every managed device to see whether it has been online or offline for a certain length of time.
- Background. Every minute, probe devices check the monitored SNMP device and send a message to Endpoint Manager to signal that they are online. If EM does not receive this signal for three minutes then the device status is set to ‘Offline’. You will get an alert you if a device has been continuously ‘Offline’ (or ‘Online’) for the length of time you specify.
Conditions and thresholds
After choosing the items you want to monitor, you can define the conditions upon which you receive an alert. The type of information you need to provide depends on the item monitored. For example, if you select 'Disk', you can specify conditions for one of three values:

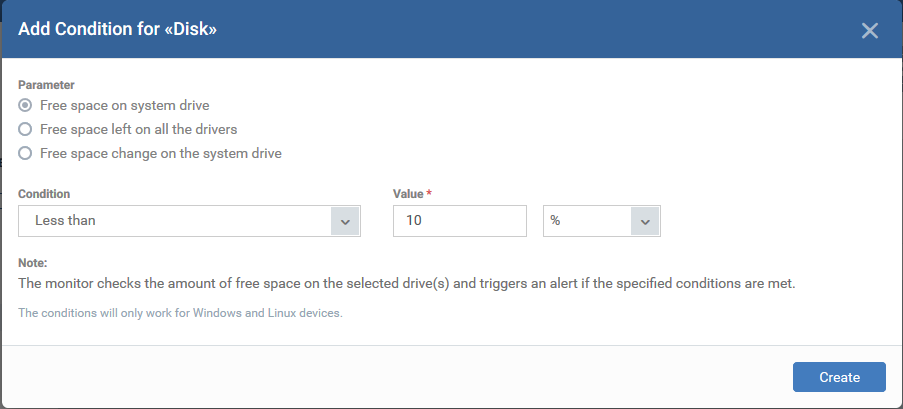
- Click 'Create' after specifying the conditions.
- Repeat the process to add more conditions

- Click 'Save' to apply your changes. Repeat the process to create more monitors.
Create a network profile and add monitors
- Click 'Network Management' > 'Profiles'
- Click 'Create'

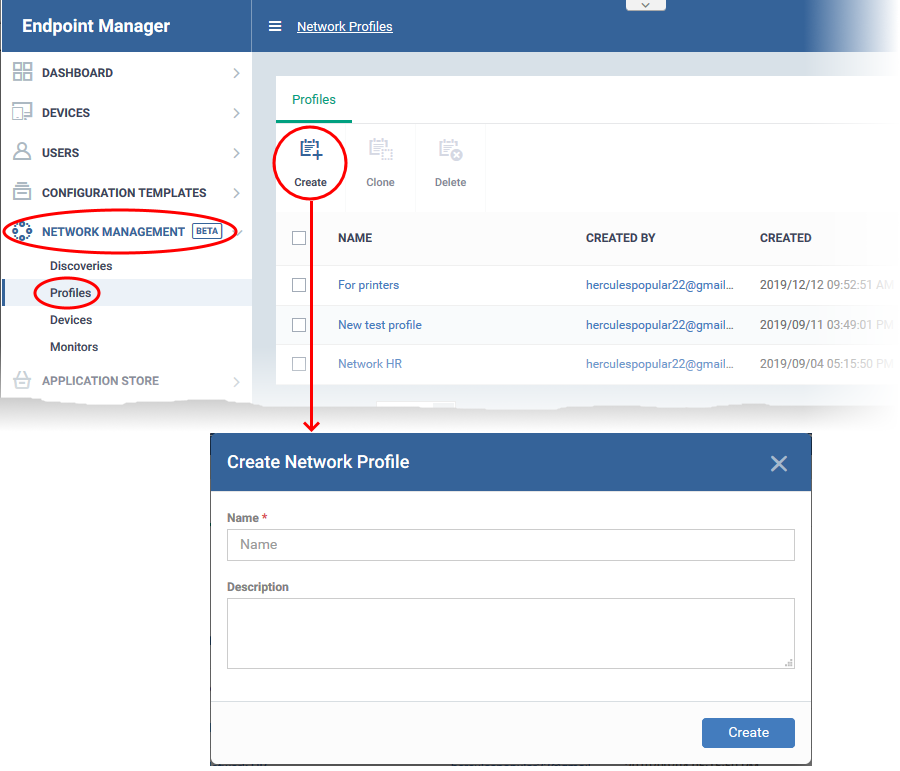
- Name - Create a label for the profile. For example, 'Profile for printers'.
- Description- Add any short notes you think are required.
- Click 'Create'. This opens the profile, ready for you to configure.

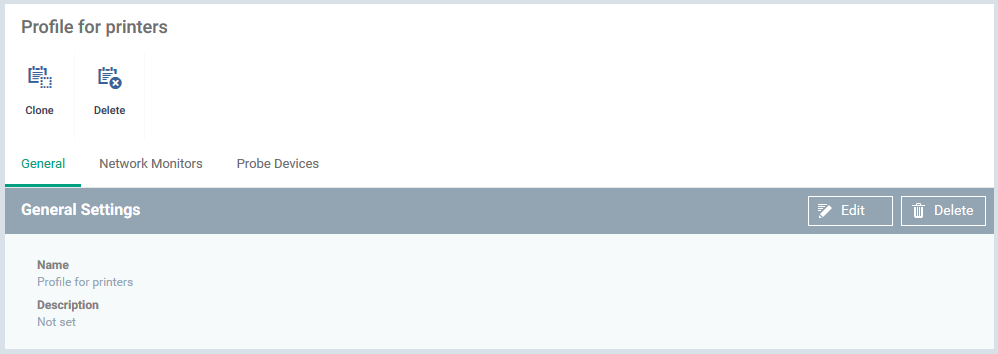
- Click 'Edit' on the right then click the 'Network Monitors' tab
- Click 'Add Monitor'

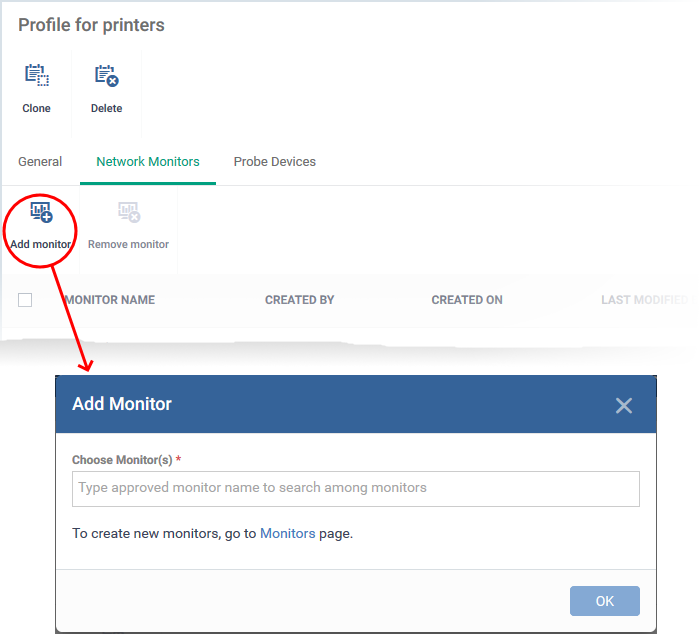
- Choose Monitors - Start typing the monitor name and select from the suggestions. You can add multiple monitors.
- See above for help if you have not yet created a monitor.
- See above for help if you have not yet created a monitor.
- Click 'OK'
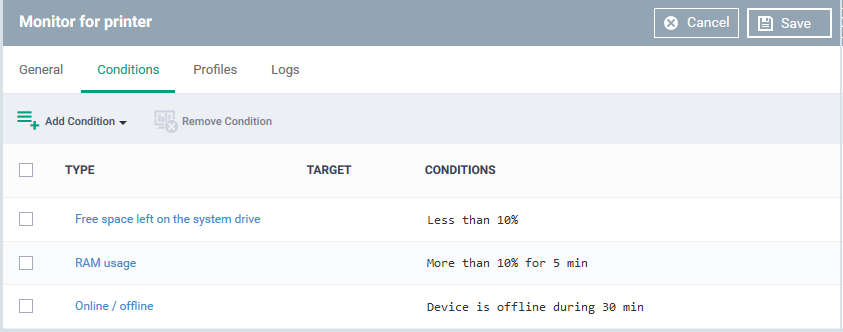
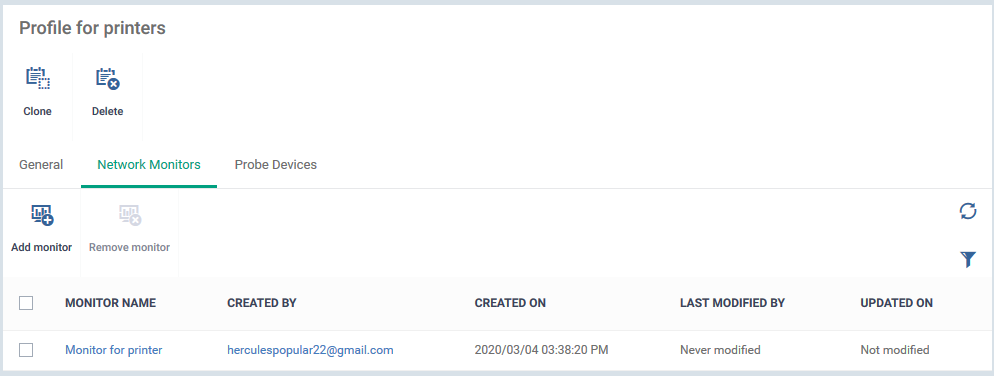
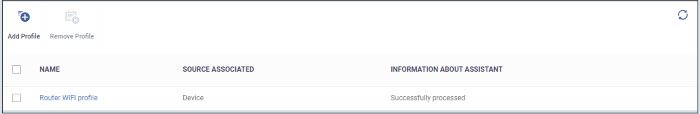
The page shows all monitors on the profile:

- Click 'Probe Devices'
- Choose the device you want to use to keep track of SNMP devices.
A probe device is a managed Windows endpoint inside your target network. The device must already be enrolled to Endpoint Manager and have the communication client installed. This device will run the monitors on your target SNMP devices.
- Click 'Add'

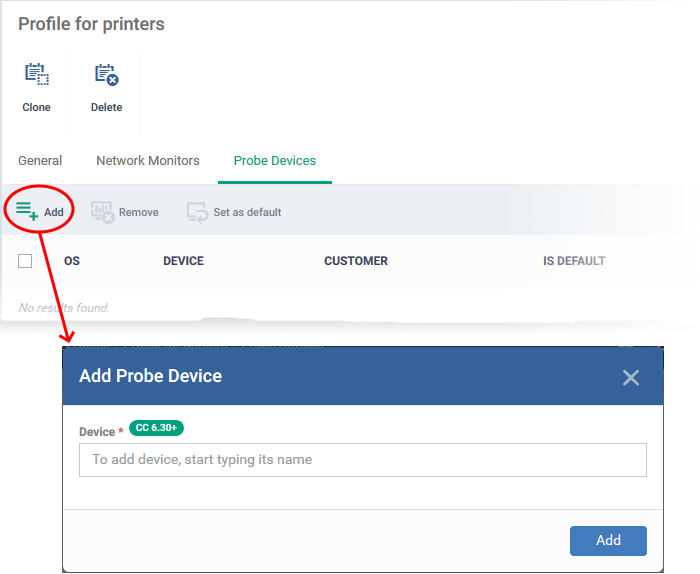
- Device - Start typing the managed Windows device name and select from the suggestions.
- Click 'Add'

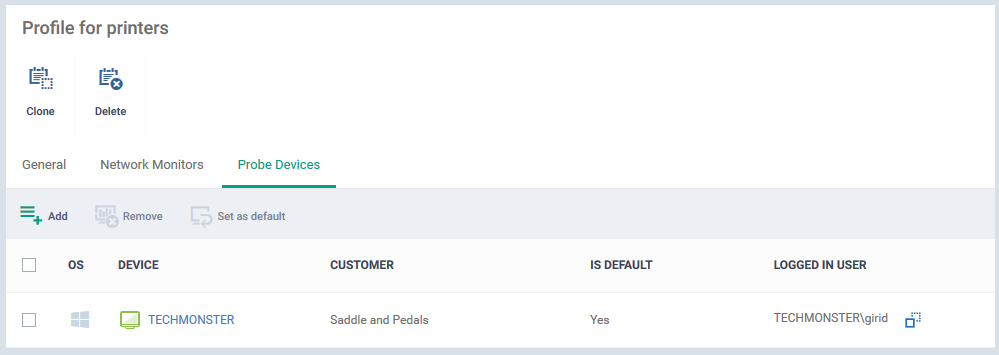
- Repeat the process to add more probe devices. More devices act as fail-overs for each other.
- Note - The first device that you add is the default probe device. If you want to change this, select the new probe then click 'Set as default'.
Apply profile to devices
Make sure you have added SNMP devices to Endpoint Manager as explained in the prerequisites.
- Click 'Network Management' > 'Devices'
- Click the 'Managed Devices' tab (if not already open)
- Select a company or a group to view SNMP devices in that group
Or
- Select 'Show all' to view every managed SNMP device
- Select a company or a group to view SNMP devices in that group
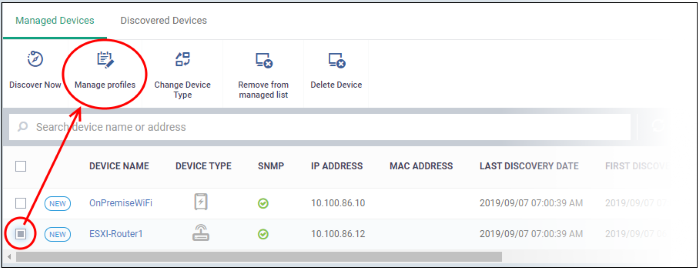
- Select an SNMP device then click 'Manage profiles'

- Click 'Add Profile'

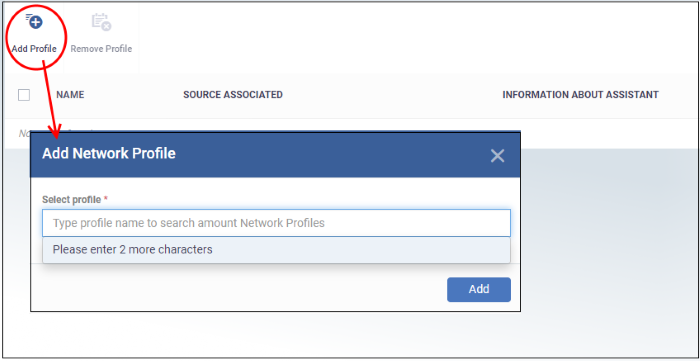
- Select Profile - Start typing the name of the profile you want to add and select from the suggestions.
- See above for help if you have not yet created a profile.
- See above for help if you have not yet created a profile.
- Click 'Add'

- Repeat the process to add more profiles
Once the profiles are deployed, the monitors will track activity on the target SNMP devices. You will receive an alert if the device breaks the conditions of the monitor.
View monitor logs
The logs show events where the conditions of the monitor were breached on the device.
- Click 'Network Management' > 'Monitors'
- Click the name of a network monitor.
- Click the 'Logs' tab

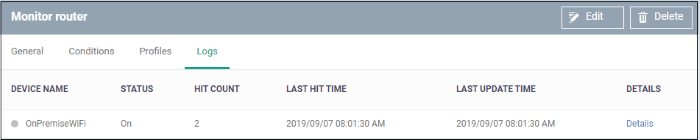
- Device Name - The SNMP device on which the breach occurred.
- Click the name of the SNMP device to view its details
- Click the name of the SNMP device to view its details
- Status - Whether or not the monitor is currently active for the device
- Hit Count - Number of times the monitored conditions were breached
- Last Hit Time - Date and time the monitoring rule was last breached
- Last Update Time - Date and time when the information was last refreshed
- Details - Click the details link to view a timeline of the event:
Details are shown in three tabs:

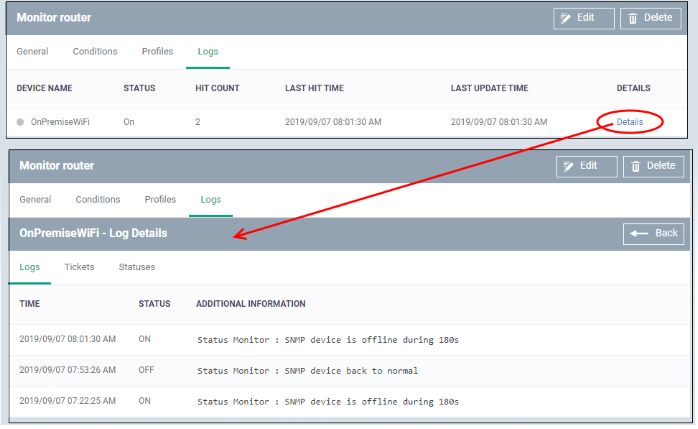
- Logs - Date and time the event occurred. It also shows the monitoring rule that detected the event.
- Tickets - Shows any Service Desk tickets created by the events.
- Statuses - Shows the current state of all conditions monitored on the device.


---