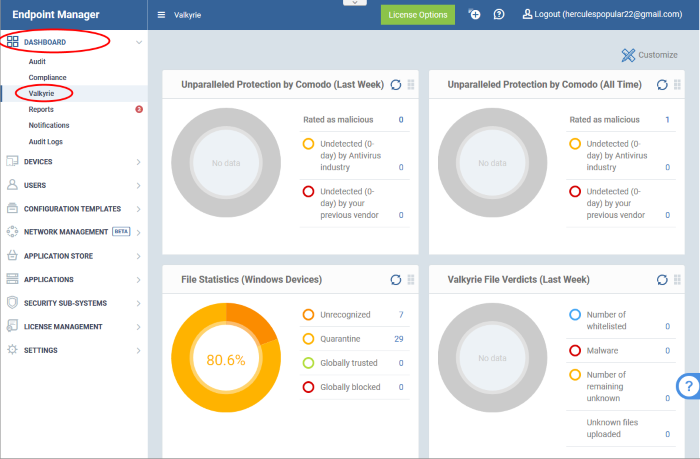
How to use the dashboard to view info about your devices, clients, and security posture
Open Endpoint Manager > click 'Dashboard'
- The dashboard shows real-time data about the operating system, connection status and security posture of all devices enrolled to Endpoint Manager (EM).
- It contains charts about device types, platforms, ownership, scan and compliance status, and Valkyrie results.
- You can customize the dashboard to show only the charts you want.
There are three dashboards:
- Audit - Charts which show the operating system and client version installed on devices on your network. The dashboard also has charts for device type, and whether the devices are personal or corporate.
- Compliance - Statistics which show how compliant your devices are with Endpoint Manager security policies. For example, device connection status, devices with viruses, devices with blacklisted applications, rooted and jailbroken devices, device scan status, vulnerability status and patch status.
- Valkyrie - A summary of verdicts on unknown files submitted to the Valkyrie file analysis system. See Valkyrie for more details.
Use the links below to jump to the task you need help with:
- Login to Comodo One / Dragon
- Click 'Applications' > 'Endpoint Manager'
- Click 'Dashboard' > 'Audit'
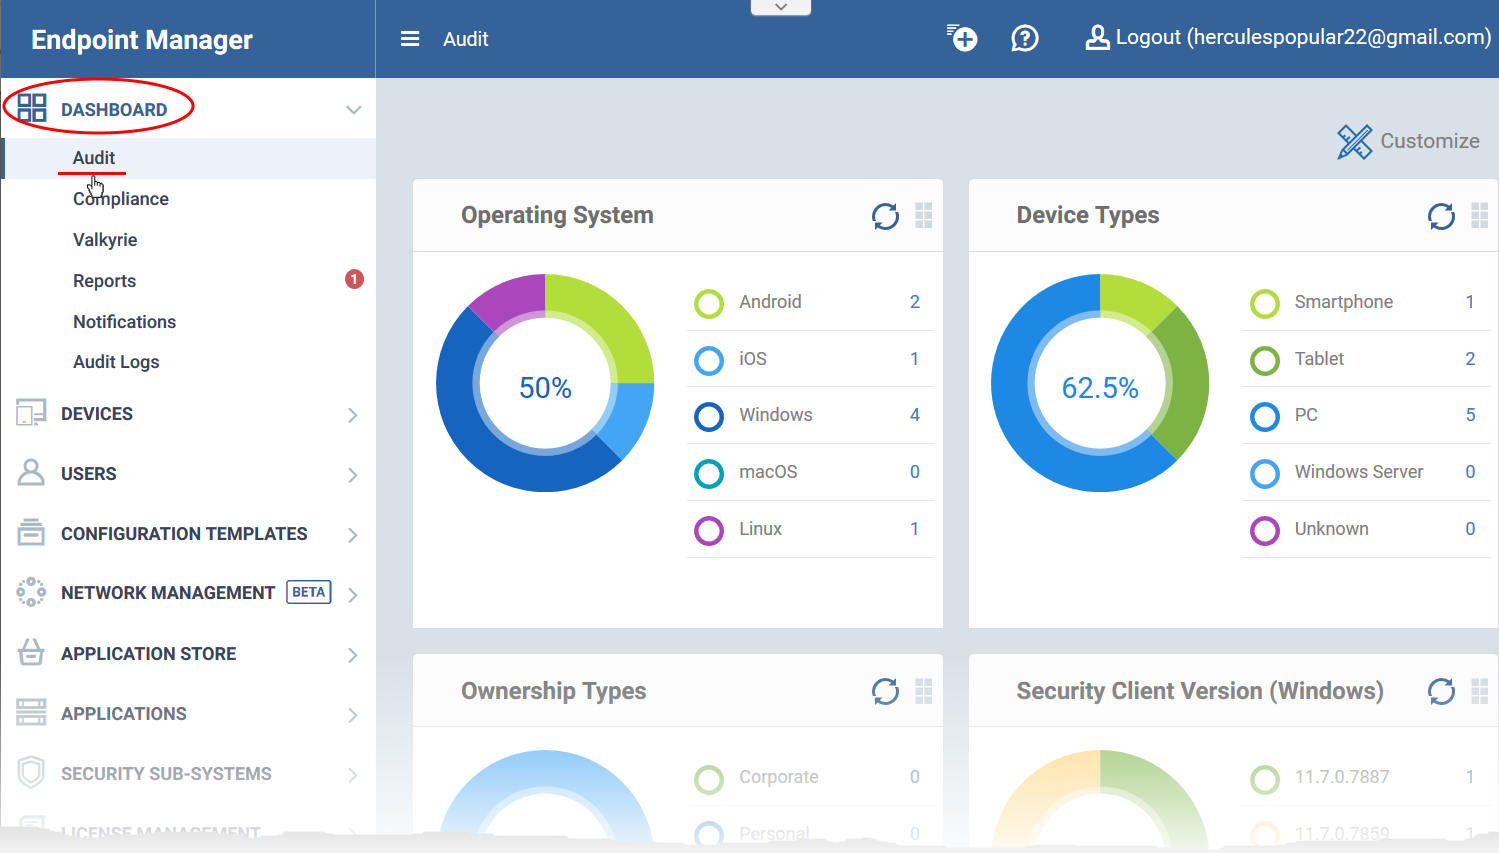
The audit charts show details about your managed devices, their operating system, ownership type, client version and more.
|
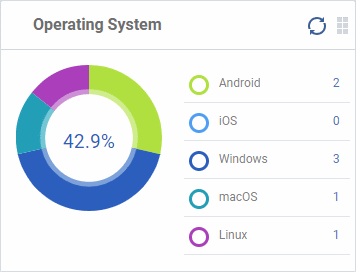
Operating System Shows enrolled devices by operating system. Place your mouse over any chart sector to see further details. Click an OS in the legend to view all devices which use that operating system. |
  |
|
|
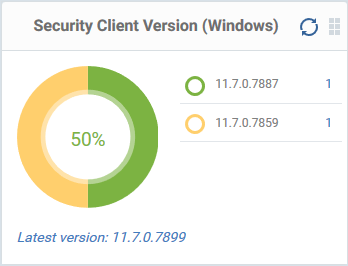
The versions of Comodo Client Security installed on Windows devices on your network. Comodo Client Security is the antivirus/security software on an endpoint.
Update to the latest version - Click the number, select the target devices, then click 'Install or Manage Packages'. |
|
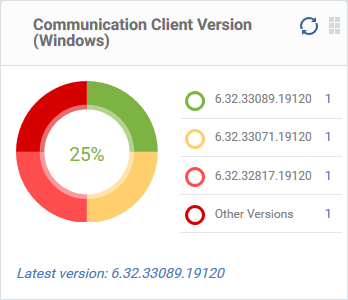
The communication client versions installed on Windows devices on your network. This is the agent which sends updates to the EM console.
|
  |
 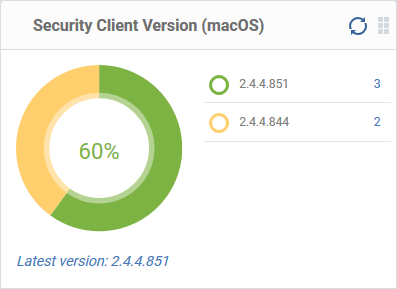 |
Security Client Version (Mac OS) The versions of the security client installed on MAC OS devices on your network. The security client is the Comodo Client Security for MAC (CCS for Mac) software on an endpoint.
|
|
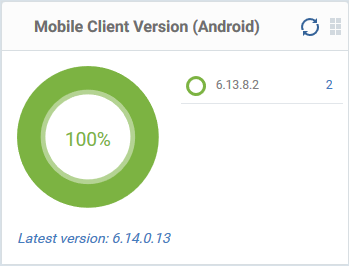
Mobile Agent Version (Android) The versions of the mobile agent installed on Android devices in your network.
|
  |
 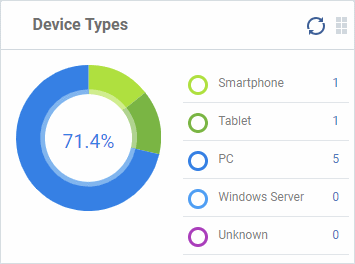 |
Device Types
Shows the composition of your device fleet by device type. Place your mouse over any chart sector see further details. Click a device type in the legend to view all devices of that type. |
|
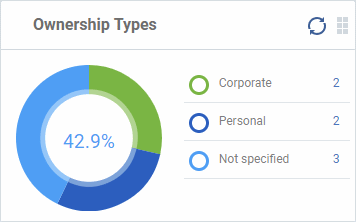
Ownership Types Ownership types can be 'Corporate', 'Personal' or 'Not Specified'. Click an ownership type in the legend to view a list of all devices of that type. Change ownership type:
|
  |

- The compliance dashboard shows the status of managed devices with regard to various security and activity criteria.
- Charts shown include devices with viruses, devices with blacklisted applications, devices which require updates, rooted and jail-broken devices, devices which are unresponsive, devices that are vulnerable, devices that need OS patch updates and more.
- Click 'Dashboard' > 'Compliance'.

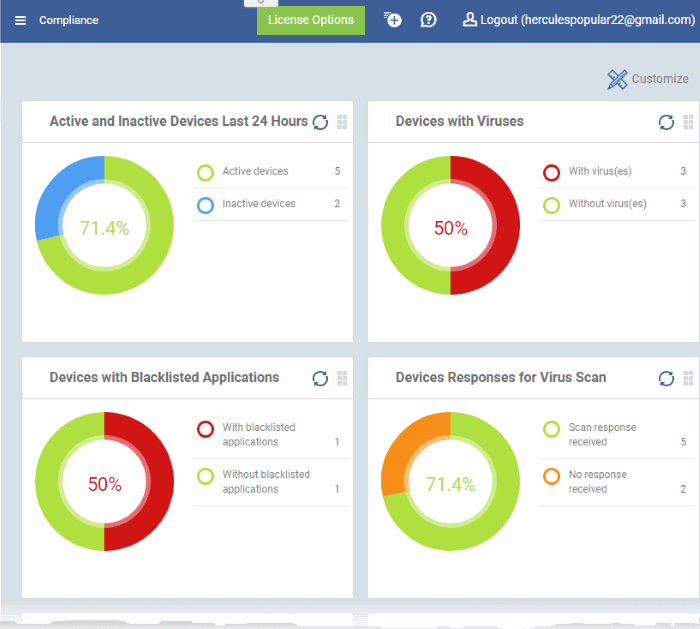
Devices With Viruses
- Shows how many enrolled devices are affected by viruses and how many are clean.
- Place your mouse cursor a sector to view further details.

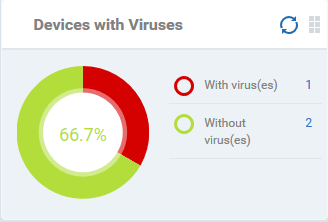
- Click an item in the legend to view all devices which have that status.
Active and Inactive Devices Last 24 Hours
- Shows the connectivity status of enrolled devices.
- Devices which have not contacted EM for more than 24 hours are marked as 'inactive'.
- Place your mouse over any chart sector to view further details.

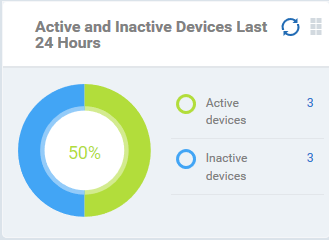
- Click an item in the legend to view all devices which have that status..
Devices with Blacklisted Applications
- Shows how many devices have banned apps installed, and how many do not.
- Place your mouse over any chart sector to view further details.

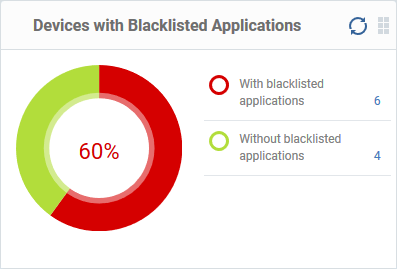
- Click an item in the legend to view all devices which have that status.
Devices Responses for Virus Scan
- Shows how many devices have responded to virus scan requests.
- Place your mouse over any chart sector view further details.

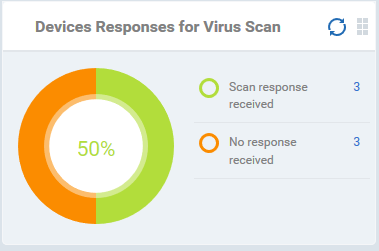
- Click an item in the legend to view all devices with that status.
Rooted And Jail-broken Devices
- Shows how many devices in your fleet are rooted or jail-broken.
- Place your mouse over any sector to view further details.
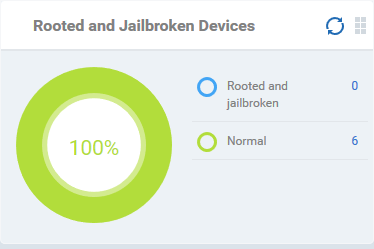
- Click an item in the legend to view all devices which have that status.
Devices With Device Management Apps
- Shows how many devices have the communication client/ EM app installed. Devices can only be enrolled if they have the communication client or Endpoint Manager app installed.
- Place your mouse over any chart sector to view further details.

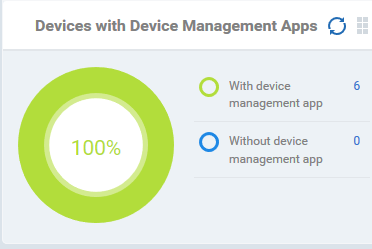
- Click an item in the legend to view all devices which have that status.
Device Online
- Shows enrolled devices by online/offline status.
- Devices are shown as offline if they are turned-off, if communication is blocked for other reasons, or if Communication Client is not running.
- Place your mouse over a sector or the legend to view further details.

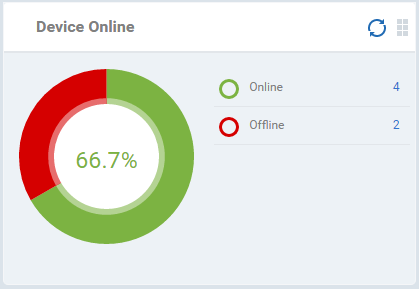
- Click an item in the legend to view all devices which have that status.
Scan Status
- Shows the progress and results of antivirus scans on enrolled devices.
- Place your mouse cursor over any chart sector to view further details.

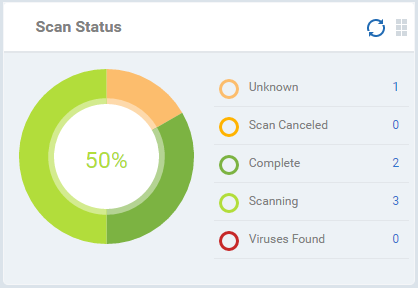
- Click an item in the legend to view all devices which have that status.
Antivirus DB Update
- Shows the progress and results of virus database updates on enrolled devices.
- Place your mouse over any chart sector to view additional details.

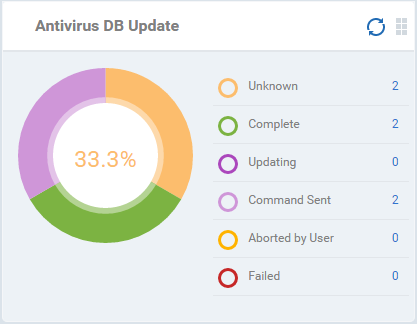
- Click an item in the legend to view all devices which have that status.
Security Product Configuration
- Shows how many of your enrolled devices have 'Safe' or 'Not Protected' statuses. 'Not Protected' means:
- Comodo Client Security (CCS) is not installed on the device.
- CCS is installed but antivirus is not enabled.
- Comodo Client Security (CCS) is not installed on the device.
- Place your mouse over any chart sector to view more details.

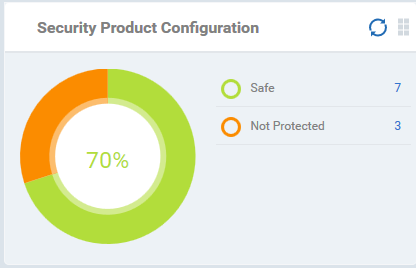
- Click an item in the legend to view all devices which have that status.
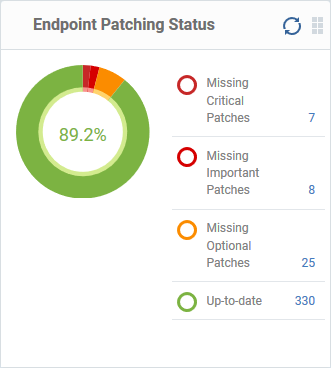
Endpoint Patching Status
Shows how many of your enrolled devices have up-to-date Operating System patches, and need to be updated for patches of different categories, depending on their criticality.
- Place your mouse over any chart sector to view more details.
- Click an item in the legend to view all devices which have that patch status.
- Click an item in the legend to view all devices which have that patch status.
- See this wiki for help run patch updates on Windows devices.
Top 5 Vulnerable Devices by Vulnerability Counts
- Shows the 5 Windows devices that rank top in having highest number of vulnerabilities.
- The number beside each device name shows the count of security patches missing on it
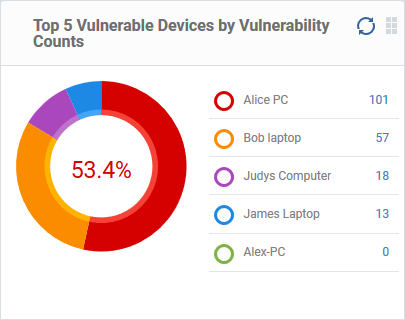
- Click on the number redirects to 'Device Details' > 'Patch Management' section
- The interface lets you remotely install missing security patches on the device
- See this page for help to install OS security patches on a device
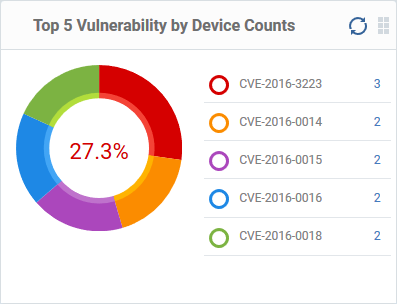
Top 5 Vulnerability by Device Counts
- Shows the Windows security patches that rank top in the number of devices missing them
- The number beside each security patch is indicated by its Common Vulnerabilities and Exposures (CVE) number
- The number beside each patch shows the number of devices missing that patch
- Place your mouse over any chart sector to view more details.
- Click a number to view the list of devices missing that patch in 'Applications' > 'Vulnerability Management' > 'Devices interface'
- You can install the missing patches on the devices from this interface.
- See this wiki to read more about installing security patches on vulnerable devices
- The number beside each security patch is indicated by its Common Vulnerabilities and Exposures (CVE) number
Valkyrie is a file analysis service that tests the behaviour of unknown files to identify whether they are malicious or trustworthy.
- You need to apply a profile with a 'Valkyrie' section to use the service.
- Click 'Configuration Templates' > 'Profiles'
- Click the name of the profile you want to edit, or click 'Create' to make a new profile
- Click the 'Add Profile Section' button > 'Valkyrie'
- Select the options and click 'Save'
- Click 'Configuration Templates' > 'Profiles'
- CCS uploads all unknown files to Valkyrie for analysis. The results of these tests are shown in the Valkyrie dashboard.
|
|
View Valkyrie result charts
- Click 'Dashboard' > 'Valkyrie'.
|
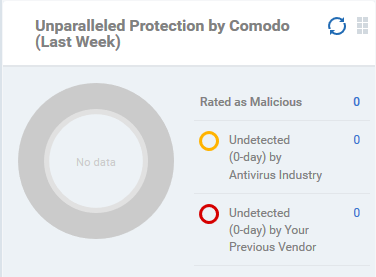
Unparalleled Protection by Comodo (Last Week) The number of threats detected by Valkyrie over the past week versus the number detected by your previous antivirus software, and by the antivirus industry as a whole. |
  |
 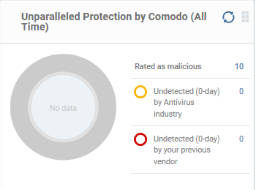 |
Unparalleled Protection By Comodo (All Time)
The number of threats detected by Valkyrie since installation versus the number detected by your previous antivirus software, and by the antivirus industry as a whole. |
|
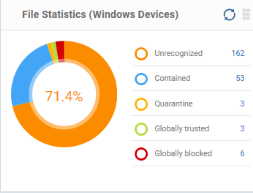
File Statistics (Windows Devices) The trust rating and status of files on your network. Click any item in the legend to view a list of files which have that status. |
  |
 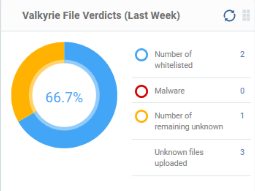 |
Valkyrie File Verdicts (Last Week) Valkyrie trust verdicts on unknown files for the past 7 days. This includes the number of unknown files found to be malicious, those that remain unknown, and those that were white-listed because they are safe. |
|
Valkyrie File Verdicts (All Time) Valkyrie trust verdicts on unknown files for the lifetime of your account. This includes the number of unknown files found to be malicious, those that remain unknown, and those that were white-listed because they are safe. |
  |
The customize option lets you choose which charts are shown on your dashboards.
- Click 'Dashboard' then either 'Audit', 'Compliance' or 'Valkyrie'
- Click 'Customize' at top-right

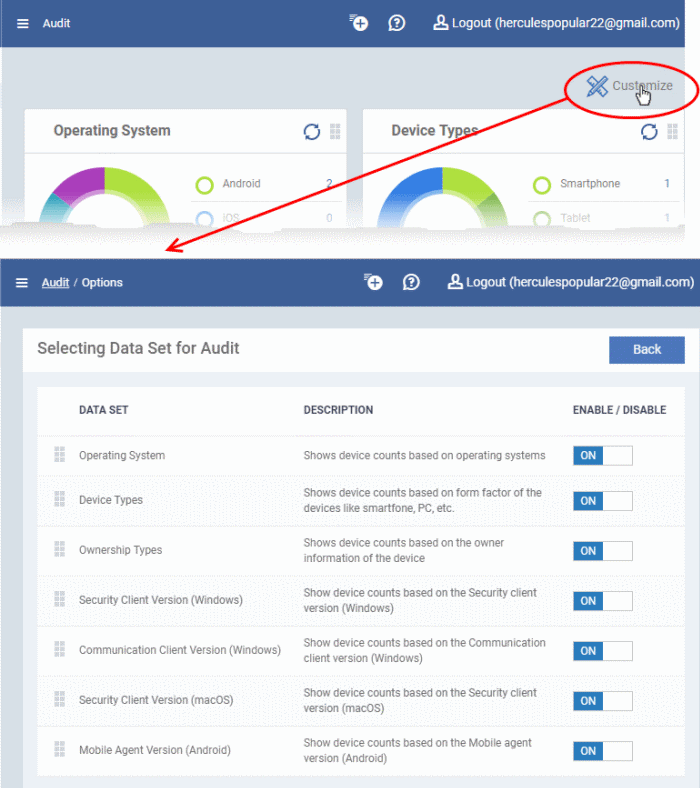
- Use the 'On/Off' switches to add or remove charts from the dashboard
- Click the 'Customize' icon
to view the number of charts removed from the default view
- Click and hold the icon at top-right of a tile to move it around the page.
- Click the 'Refresh' icon in any tile to reload the statistics.


---