North America
How to view logs of admin/staff actions in Endpoint Manager
Views
3265 times
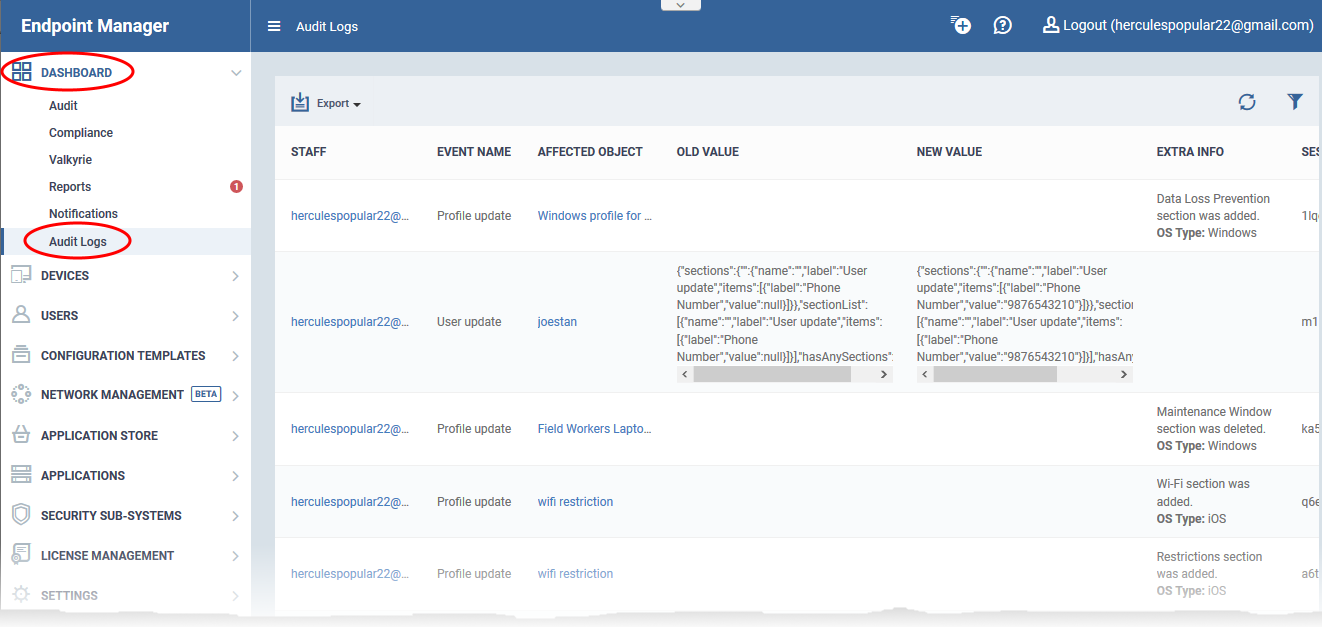
Click 'Dashboard' > Audit Logs'
- Endpoint Manager logs all actions taken on managed devices by admins and staff. These logs can be useful when troubleshooting issues.
- Example logged actions include:
- Add, update or remove users / user groups
- Send password recovery mails to users
- Add or remove devices / device groups
- Apply a security profile
- Create or edit a profile
- Package installations
- Remote take-over sessions
- Changes to containment settings
- Remote file transfers
- Auto-removal of old / duplicate devices
- Remote execution of command line and powershell commands
- Generate reports
- Add, update or remove users / user groups
- Each log entry is accompanied with details such as the staff member who applied the action, the affected device, the action taken, and more.
- Audit logs are maintained for up to a year for PCI-DSS compliance.
The logs screen shows activities in chronological order.
- Staff - Username of the admin or staff member who performed the action.
- Event Name - The action executed. Examples include user enrollment and update, device enrollment, profile update, remote installation of packages, remote take-overs, remote tools sessions and device removals.
- Affected Object - The device, device group, profile, procedure or filegroup which was the target of the action.
- Click the name to view more details about the item.
- Click the name to view more details about the item.
- Old Value - The setting or value before the action was implemented.
For example, if a Comodo package is remotely updated, the old version number of the package is shown here.
- New Value - The setting or value after the action was implemented.
For example, if a Comodo package is remotely updated, the version number of the new package is shown here.
- Extra Info - Additional details about the action. These include devices on which the procedure was run, installation parameters, profiles applied/removed, malware quarantined, scans run and so on.
Script or patch procedures - Click 'Selected Devices' to view the devices on which the procedure was run.
- Session ID - String that identifies the connection session between the device and the EM server during the action.
- Log Creation Date - Date and time of the event.
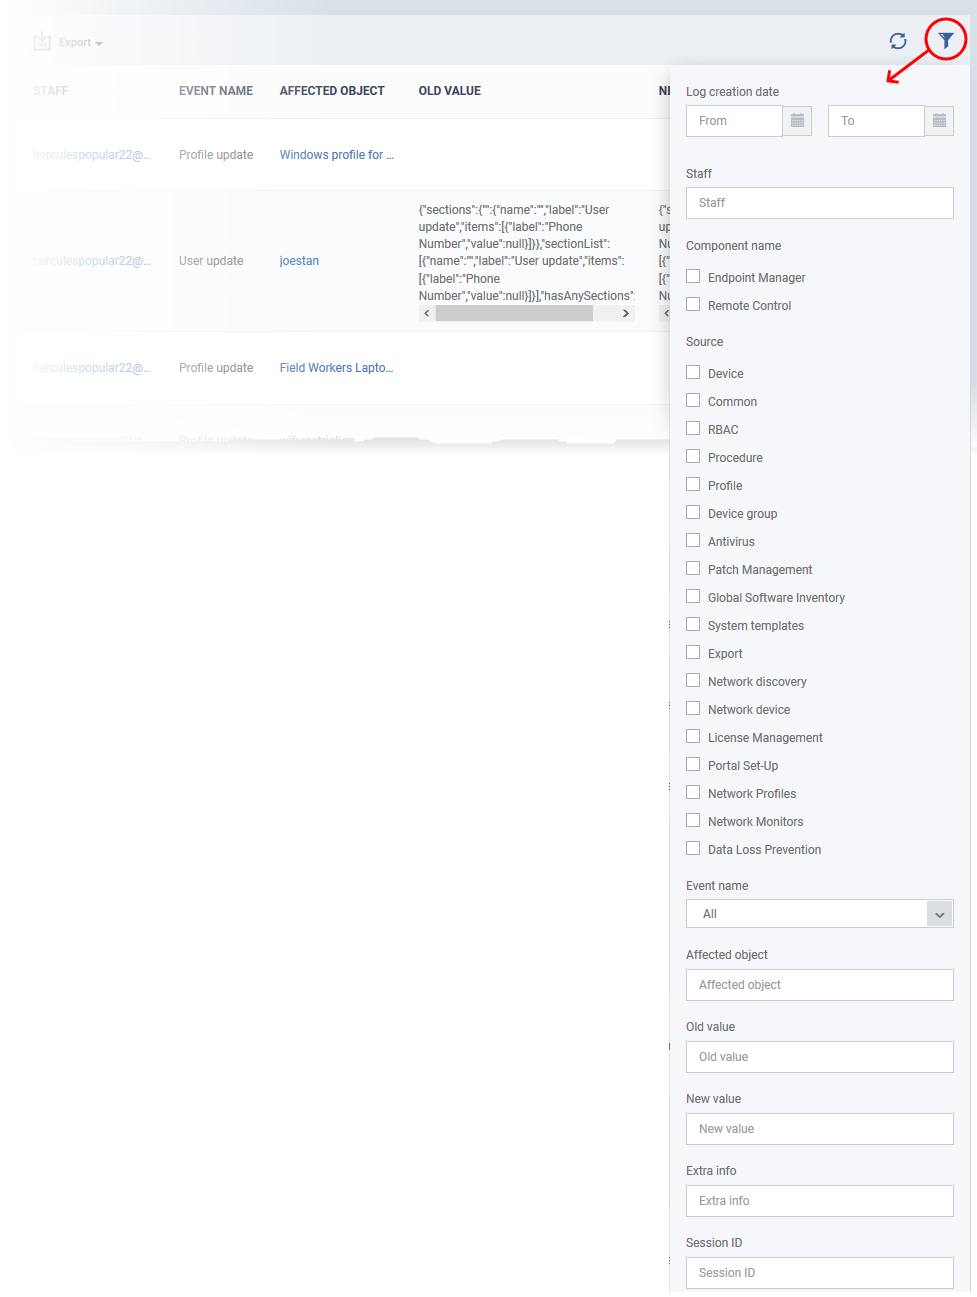
Use the filters to view events of a specific type, events that affected a specific object, and more:
- Click the funnel icon at the top right.
You can filter items by various criteria or search for specific events.
- Component name – Select whether you want to view the events from the EM portal of from the Remote Control sessions handled by admins and staff.
- Source – Select the category of objects affected by the actions for which you want to see the logs
- Event name - Select the type of action
- Affected object – Enter the label of the user, user group, device, device group, profile, procedure or file group affected by the event
- Old Value – Type a value string to view events where that value was changed.
- New Value - Type a value string to view events where that value was implemented
- Extra info – Enter additional details about the actions for which you want to see the logs.
- Session ID – Enter the connection session identification string of a device to view only the actions executed during that session
Select your filter criteria and click 'Apply'.
Generate Log Reports
You can generate a log report for up to the past 90 days.
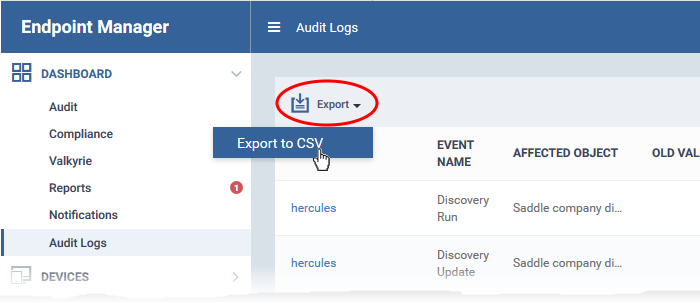
- Click 'Dashboard' > 'Audit Logs'.
- Click the funnel icon to filter which records are included in the report.
- Click 'Export' above the table then choose 'Export to CSV'.
- Go to 'Dashboard' > 'Reports' to download the report.
- See this page for more advice on reports.


