How to understand the charts on the Comodo One / Dragon dashboard
Click the 'Comodo One / Dragon' logo at the top left to view the dashboard
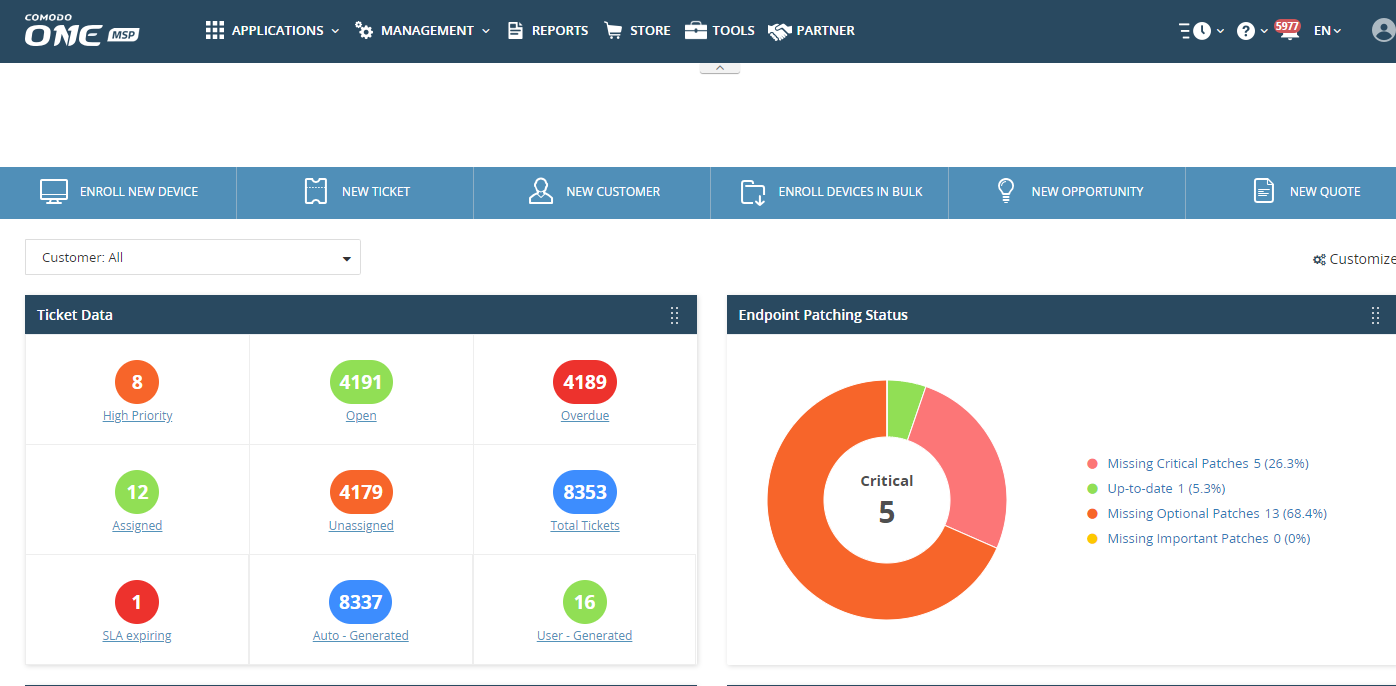
- The dashboard contains statistics and information from all Comodo One / Dragon modules. This includes service desk tickets, endpoint patches, operating system info, security policies, and more.
- You can select which charts which are shown and choose the page layout.
Use the following links to jump to the area you need help with:
- The Dashboard
- Dashboard charts
- Ticket data
- Ticket status
- Security status
- Activity status
- Device type
- Operating systems
- Profile status
- Status per company
- Endpoint patching status
- EM - OS Patches by classification
- EM - Patch management - third party applications
- EM - Total security patches - Needed by severity
- Secure Internet Gateway
- Sales funnel
- Help actions
- Ticket data
- Click the 'Comodo One / Dragon' logo at top-left to open the dashboard at any time.

MSP customers - The dashboard shows combined stats for all companies you have added to the account. You can change this to show individual companies if required:
- Click the 'Customer' drop-down on the left
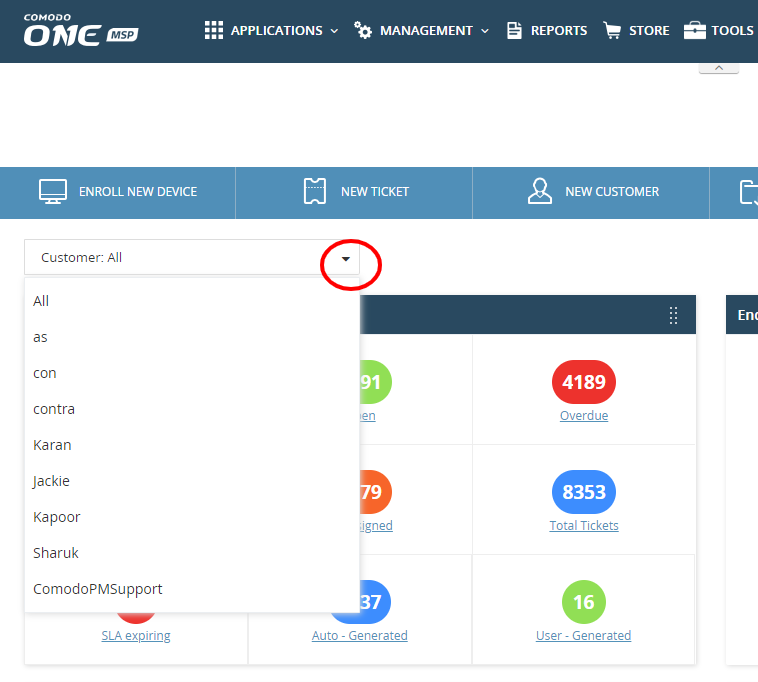

- 'All' - View statistics for all companies
or
- Select a specific a company. The dashboard will auto-update with your chosen statistics.
- Click 'Customize' at the right of the interface:

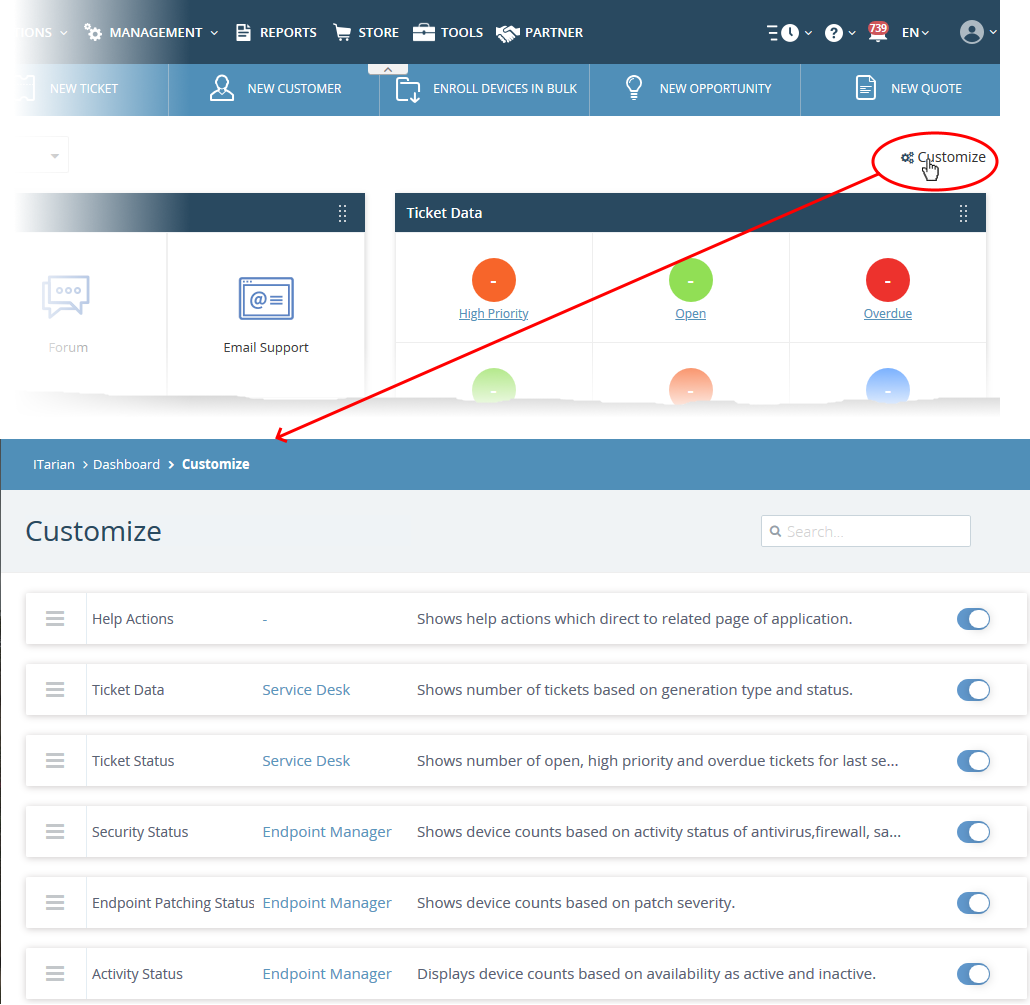
- Use the switches on the right to show or hide an item.
- Drag-and-drop a row to re-order it on the dashboard.
- The changes are automatically applied. Click the 'Comodo One / Dragon' logo to return to the dashboard.
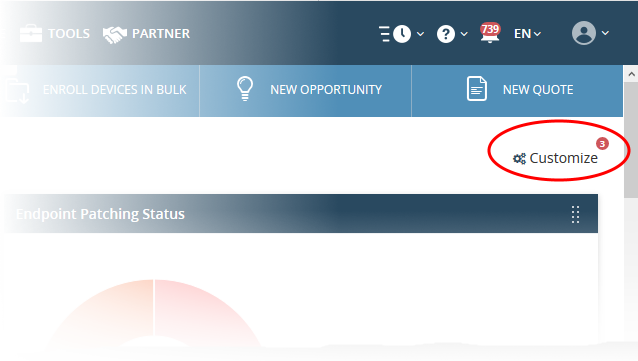
- The number of disabled components is shown next to the 'Customize' link.
You can also rearrange the tiles by dragging and dropping them to desired position

- Click the vertical ellipses at the top right of a tile and move it to the desired location

There are 15 available charts in Comodo One / Dragon dashboard:
- Ticket data
- Ticket status
- Security status
- Activity status
- Device type
- Operating systems
- Profile status
- Status per company
- Endpoint patching status
- EM - OS Patches by classification
- EM - Patch management - third party applications
- EM - Total security patches - Needed by severity
- Secure Internet Gateway
- Sales funnel
- Help actions
Key data about your service desk tickets. Statistics include:
- How many tickets are open, overdue and so on.
- Number of tickets auto-created by Comodo One / Dragon apps like Endpoint Manager.
- Number of tickets created by users.

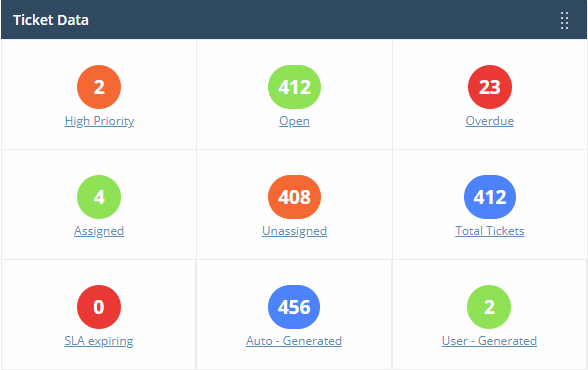
- Click any link to view the relevant list of tickets in Service Desk.
- See this wiki for help to manage tickets.
The number of overdue, open and high priority tickets at various points in time.

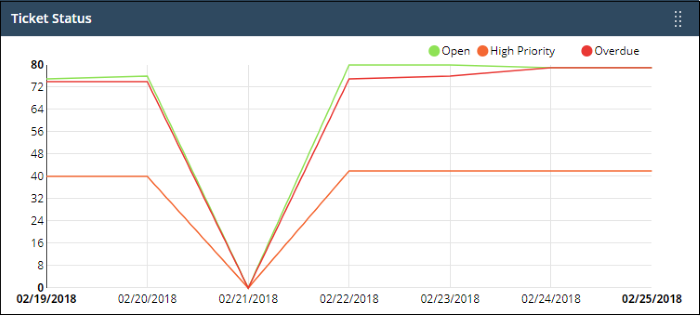
- Place your mouse cursor over a section to see the status of tickets for that particular date.
- If no tickets are available, you instead will see link - 'Click Here to Create New Ticket'.
- See this wiki for help to manage tickets.
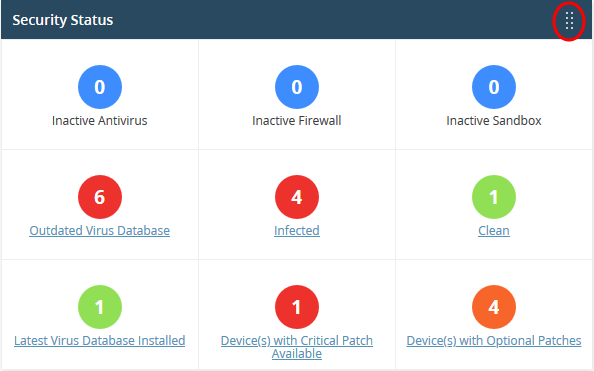
Endpoint Manager - Security status
Security information about devices you have added to Endpoint Manager. Statistics include
- How many devices have the firewall, antivirus or sandbox disabled
- How many devices need virus database updates
- How many devices are infected and how many are clean
- How many devices have operating system patches outstanding

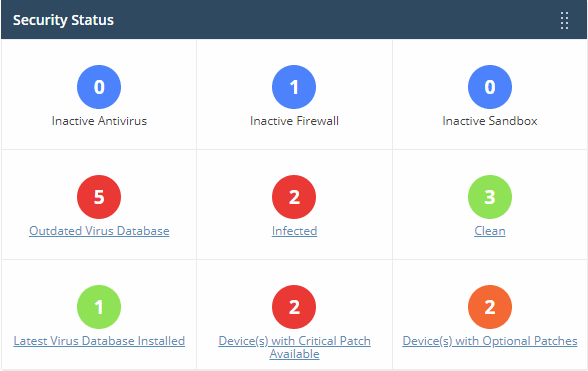
- Click any link to view the relevant list of devices in the Endpoint Manager.
- You can take required actions on the devices from this EM interface.
- See this page for help to manage the devices
Endpoint Manager - Activity status
- Shows how many of your devices are currently connected to Endpoint Manager.
- 'Inactive' means devices that have not connected for more than a day.

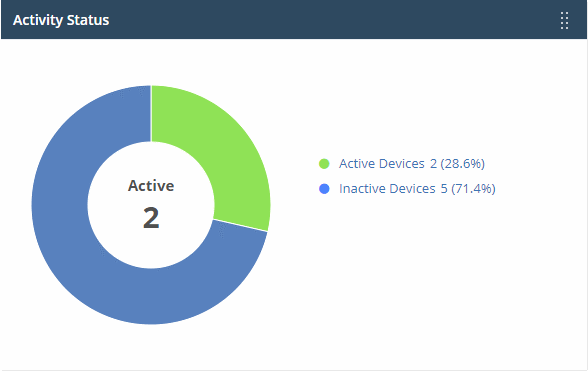
- Place your mouse on a sector to view the number of endpoints with that status.
- Click a link on the right to view the relevant list of devices in Endpoint Manager.
- See this page for help to manage the devices
Shows enrolled devices by device type.
- Types include PC, servers, smartphones and tablets.
- Device types are on the X-axis and count on the Y-axis.

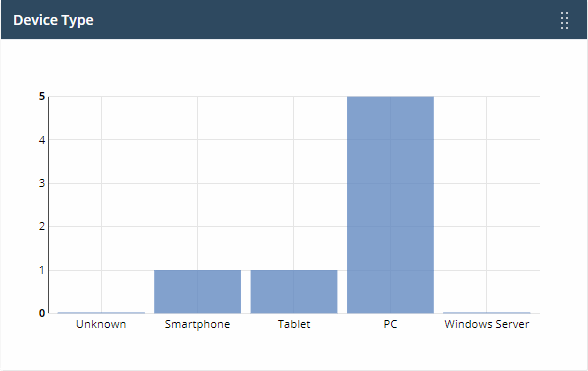
- Place your mouse on a bar to view the number of endpoints of that type.
- Click a bar to view the relevant list of devices in Endpoint Manager.
- See this page for help to manage the devices
Shows enrolled devices by operating system.
- Operating systems include Android, iOS, Windows, Mac OSX and Linux.
- Device types are on the X-axis and count on the Y-axis.
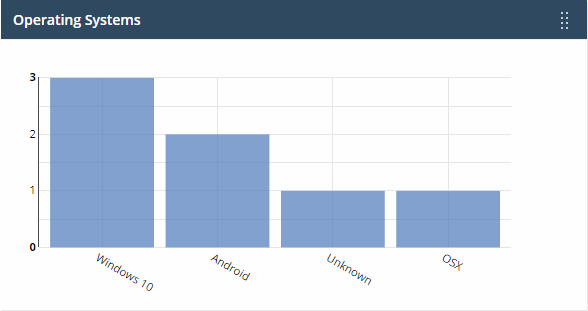

- Place your mouse on a bar to view the he number of endpoints of that OS.
- Click a bar to view the relevant list of devices in Endpoint Manager..
- If you haven't added any devices yet, then this area will instead show a link - 'Click Here to Add Devices'. See this wiki for help to enroll new devices.
How many devices of each operating system have an active Endpoint Manager profile installed.
- Operating systems are on the X-axis. The number of devices is on the Y-axis.

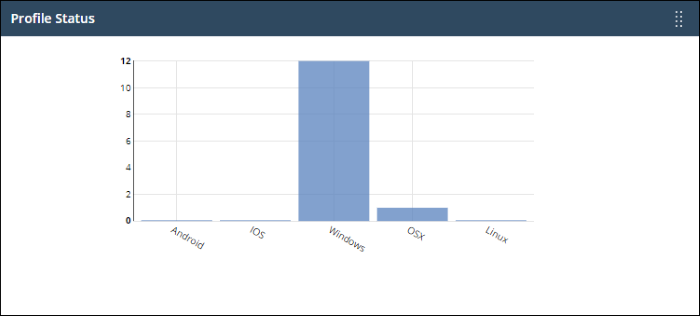
- Place your mouse on a bar to view the he number of endpoints of that category.
- Click a bar to view the relevant list of devices in Endpoint Manager.
- See this page for help to manage devices
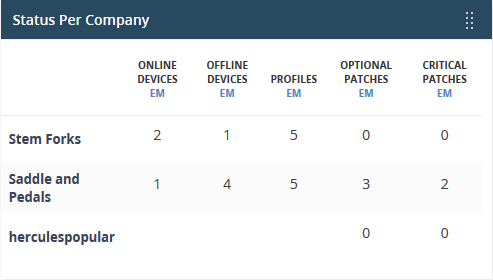
Endpoint Manager - Status per company (MSP customers only)
Summary of device status for each company you have added to Comodo One / Dragon.
- number of devices online/offline (connected to Endpoint Manager)
- number of devices with a profile installed
- number of devices that require patches.

Endpoint Manager – Endpoint patching status
Shows how many of your Windows devices are missing patches, and how many are fully patched.

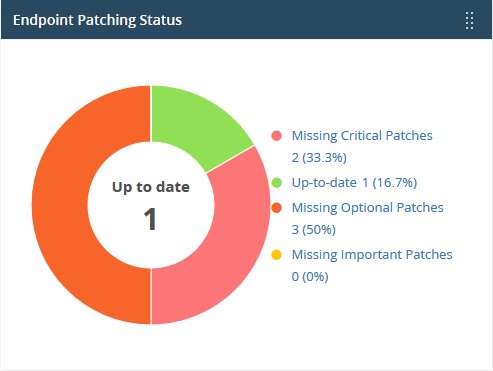
- Place your mouse on a sector to view the number of endpoints with the respective patch status.
- Click a link on the right to view the affected devices in Endpoint Manager.
- See this page for help with device management.
EM - OS Patches by classification
Shows how many of your Windows devices are missing operating system patches of different categories.

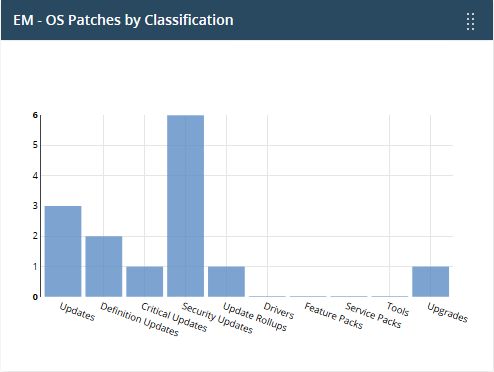
- Place your mouse over a bar to view the number of endpoints that need patches of that type.
- Click on a bar to view the missing patches, and the devices that require them.
- See this wiki for help to install missing patches.
EM - Patch management - third party applications
Shows how many Windows devices need updates for third party applications.

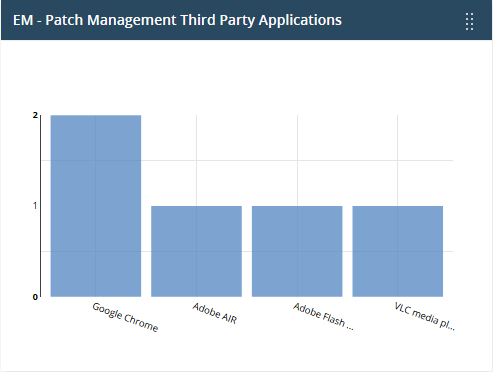
- Place your mouse over a bar to view the number of endpoints that need patches for a specific application.
- Click on a bar to see view the missing patches, and the devices that need them.
- See this wiki for help to install missing patches and updates.
Endpoint Manager - Total security patches - Needed by severity
Shows how many of your Windows devices are missing security patches by criticality.

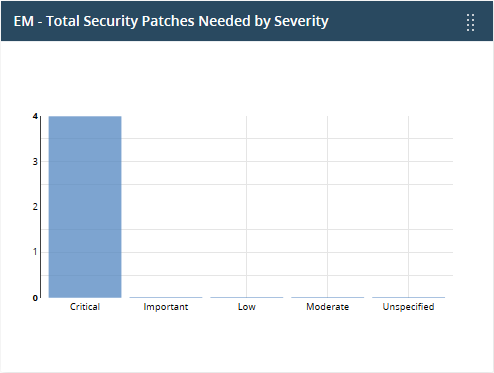
- Place your mouse over a bar to view the number of endpoints that need patches of that type.
- Click on a bar to view the missing patches, and the devices that need them.
- See this wiki for help to install missing patches and updates.
Shows threats blocked and the internet browsing patterns of devices in your network. This section is only populated if Comodo Secure Internet Gateway is active on your account.
- See the Comodo Secure Internet Gateway guide for more about the product.
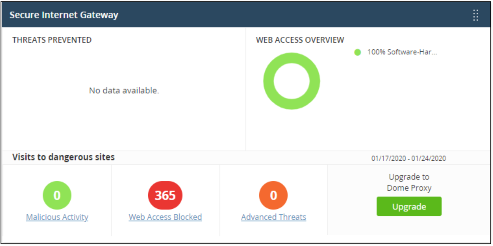

- Click any bar chart to open the relevant detail page in Comodo Secure Internet Gateway.
- The links below 'Visits to dangerous sites' take you to the reports page in Comodo Secure Internet Gateway.
- The 'Upgrade' button allows you to subscribe for other Comodo Secure products, including Comodo Secure Web Gateway and Comodo Data Loss Prevention.
The number of quotes that have been accepted, published and are in draft status.
- This widget is only available if Quote Manager is enabled.

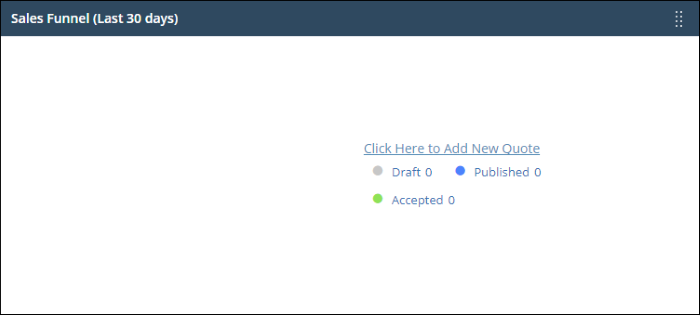
- Click a link on the right to open the relevant list of quotes in Quote Manager.
In case of any issues or clarifications regarding the application, admins can refer to help guides or write to Comodo One / Dragon support to resolve them.

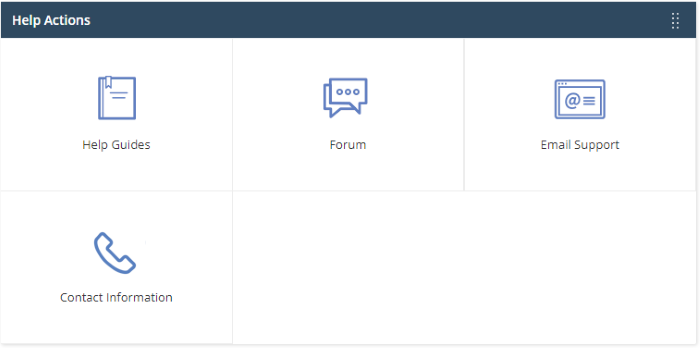
- Help Guides - View help guides for Comodo One / Dragonmodules such as Service Desk and Endpoint Manager.
- Forum - Opens the MSSP consortium forum page where you can ask questions or join in discussions.
- Email Support - Send email to our support staff for any issues.
- Contact Us - Details of support information.


---