How to view C1/Dragon and Service Desk audit logs in the portal
- Login to Comodo One / Dragon
- Click 'Management' > 'Audit Logs'
Comodo One / Dragon stores event logs from the console and from Service Desk for up to seven days.
- Comodo One / Dragon events include license activation, staff logins, add/remove customers, report creation, and more.
- Service Desk events include new ticket received, add/remove staff, FAQ/help topic updates, and more.
You can:
- Filter logs by module and event type.
- Run simple or complex queries to search for specific logs. You can also save queries for repeat searches.
- Export logs to a .csv file
- Customize which columns are shown in the interface
Use the following links for more help:
- The audit logs interface
- Add or remove columns in the log viewer
- Filter logs by time
- Use advanced search queries to filter logs
- Use saved search queries to filter logs
- Export the logs report
- Further reading - Other types of logs
- Login to Comodo One / Dragon
- Click 'Management' > 'Audit Logs'

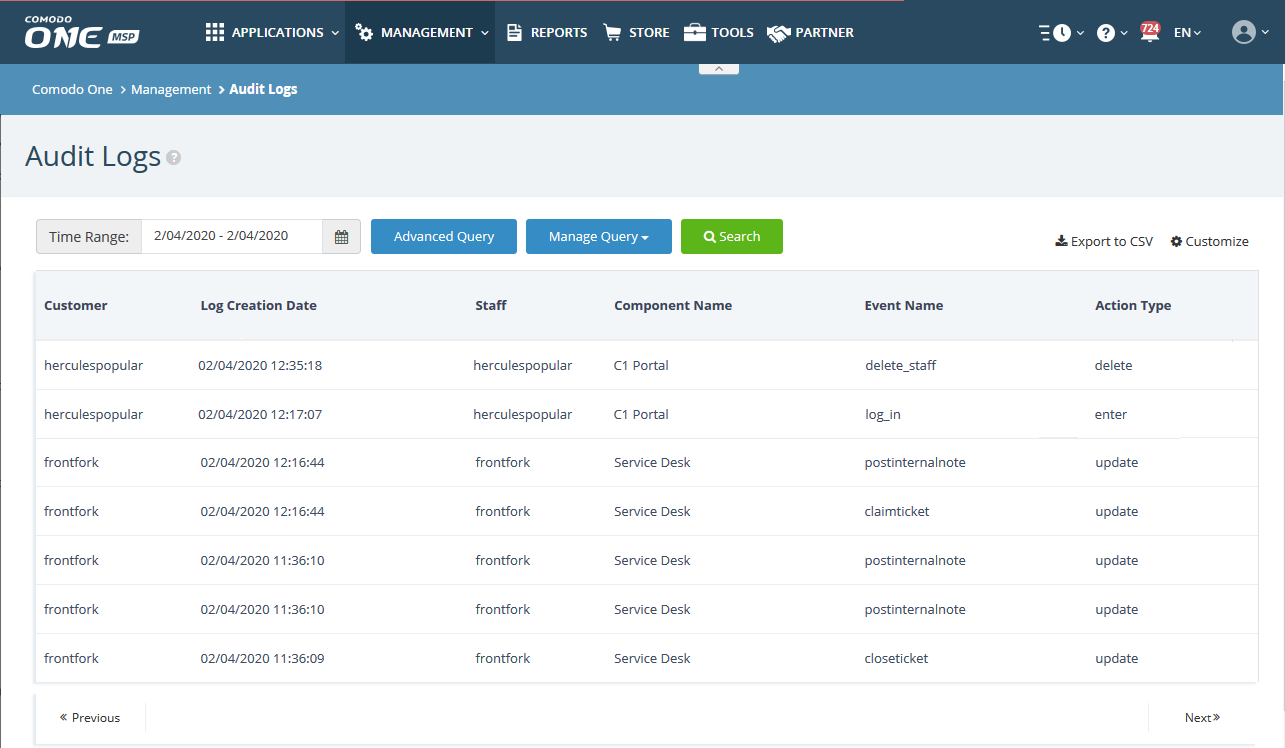
The table columns show the following details about each event:
Customer - The client company that generated the event.
- Note: The 'Customer' column is only available for MSP customers.
Log Creation Date - Time the log was generated.
Staff - Person who executed the action described in the log.
Component Name - The Comodo One / Dragon module responsible for the action. Possible values are:
- Comodo One / Dragon Portal
- Service Desk
Event Name - The event label. This is typically a very-short description of the activity which was logged. For example, ‘log_in’, ‘claimticket’ or ‘postinternalnote’.
Action Type – The basic activity performed in the event. This is usually the simple ‘action’ part of the description in the ‘Event Name’ column. Examples include ‘Update’, ‘Delete’, ‘Add’.
The following columns can be added to the table by clicking the 'Customize' button at the top-right. See 'Add/remove columns in the log viewer' for more details.
Extra Information - Additional details, if any, for the event.
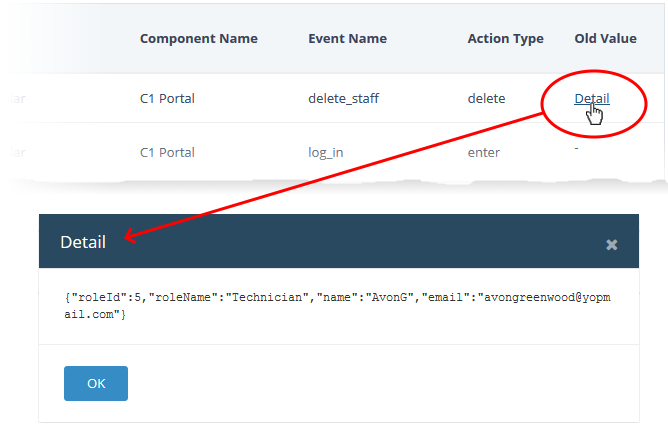
Old Value - Click the 'Detail' link to view the value of the parameter before the change.

- Session ID – Uniquely identifies the connection during which the event occurred.
- Affected Object – Identifies the parameter that was changed.
- New Value - Click the 'Detail' link to view the setting after the change.
Add/remove columns in the log viewer
The log viewer shows six columns by default. You can add more columns if you want to view additional details. You can also hide columns that you don't want to be displayed.
- Click the 'Customize' button at top-right

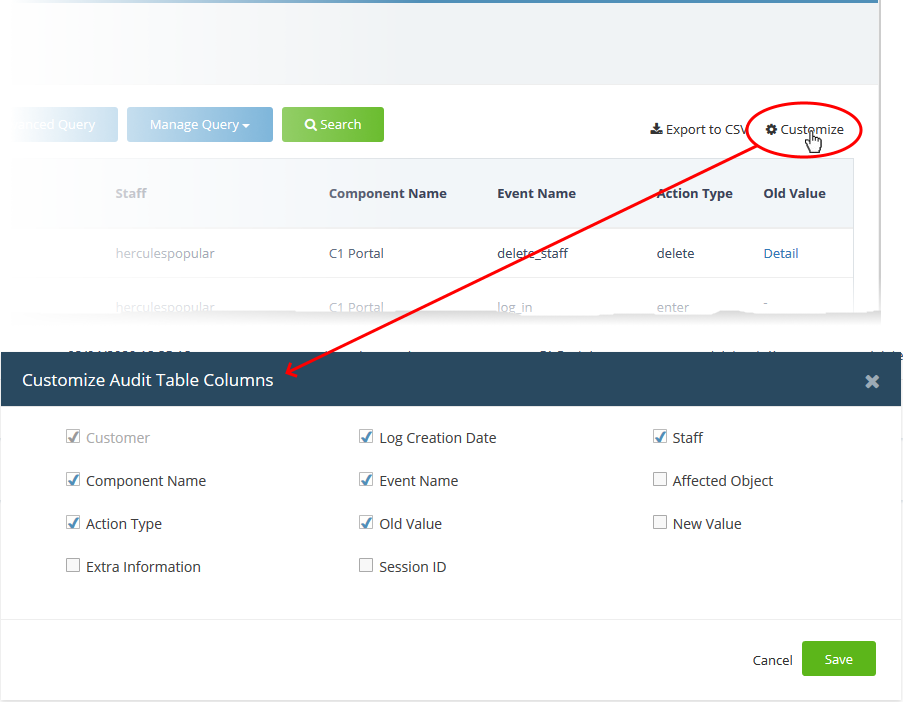
- Use the check-boxes to enable or disable columns as required
- Mandatory columns are grayed-out and cannot be disabled.
- Click 'Save' to apply your changes
- Logs are available for up to seven days prior to the current date.
- Use the 'Time Range' field at the top-left to choose the log display period.
View logs for a specific time period
- Click the calendar icon at the right of the 'Time Range' field

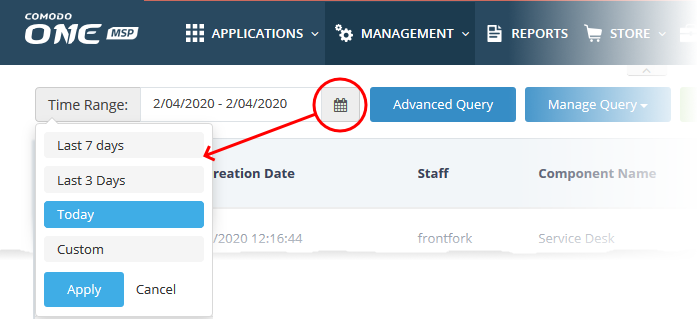
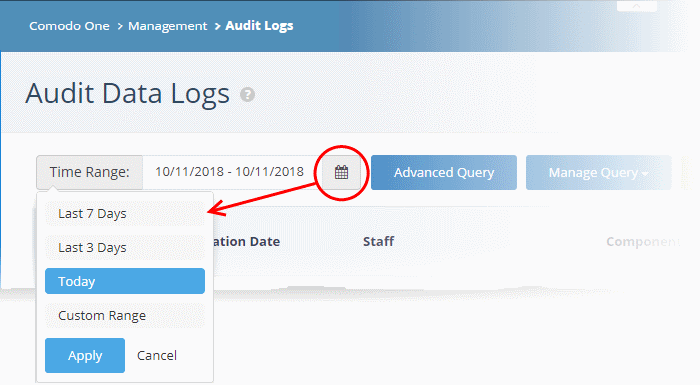

Select the time period:
- Last 7 Days - Event logs for the previous seven days
- Last 3 Days - Event logs for the previous three days
- Today - Event logs for the current day
- Custom Range - Get event logs for a specific date range.

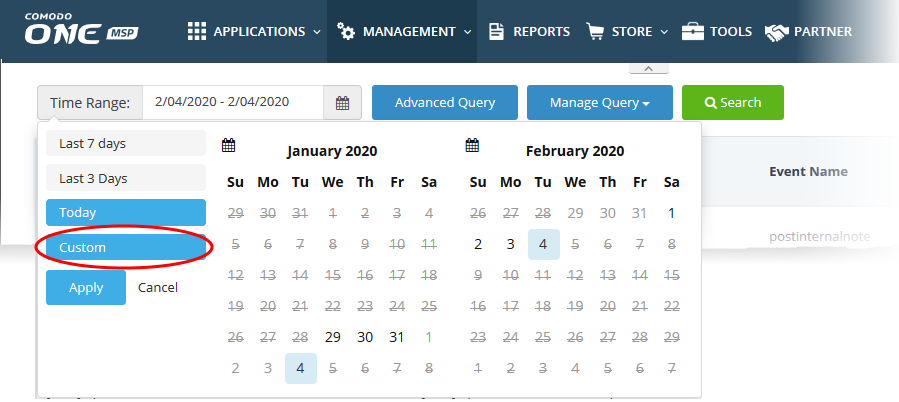
- Select the start and end dates from the calendars.
- Click 'Apply'
Use advanced search query to filter logs
- Custom search queries help you to find specific event logs.
- You can also save these queries for use in the future.
Filter logs using an advanced search query
- Click the 'Advanced Query' button at the top:

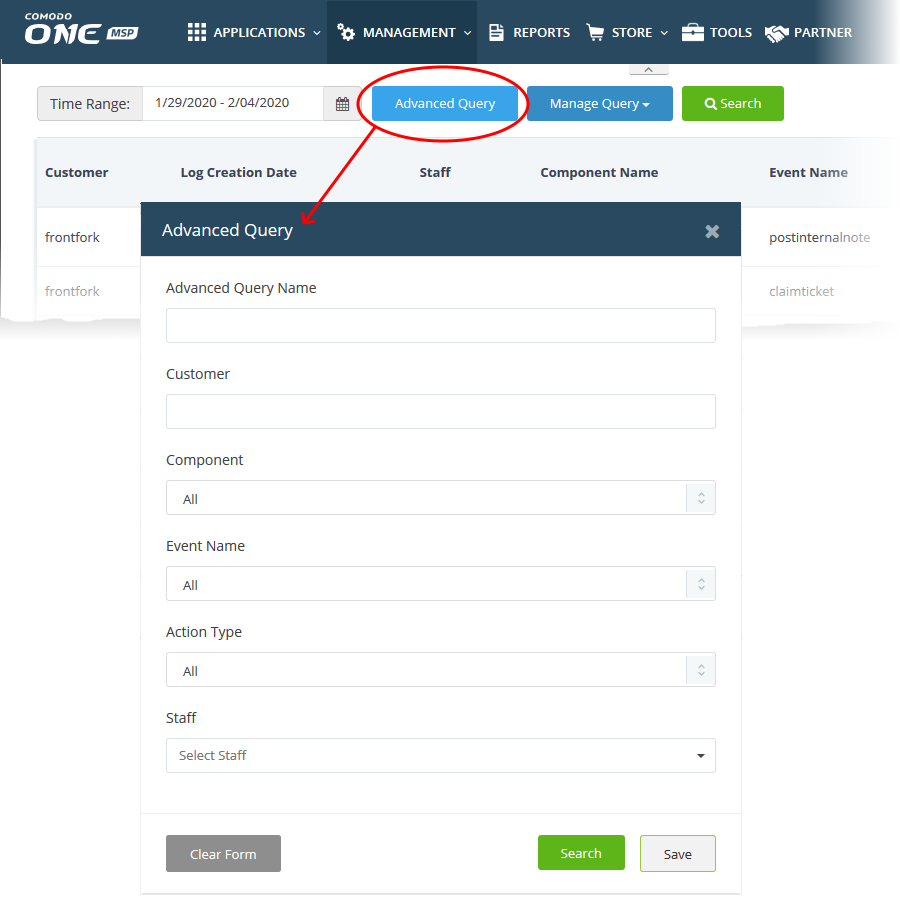
Advanced Query Name -Create a label for the query. Ideally, this should clearly identify the query’s purpose to yourself and other users.
Customer - Search for logs that concern a particular client.
Component - Search for events from specific Comodo One / Dragonmodules. The available options are:
- All
- Comodo One / Dragonportal (the Comodo One / Dragonumbrella console)
- Service Desk
Event Name - Search logs by their label.
Action Type - Search for logs that involved a certain activity. For example, ‘update’ or ‘delete’.
Staff - Search for logs which involved a named member of staff or admin
- Click 'Search' apply your filters
- Click 'Save' if you want to run the query in the future.
Use saved search queries to filter logs
- Click the 'Manage Query' button
- Select the queries you want to use from the drop-down. You can select multiple queries at once:

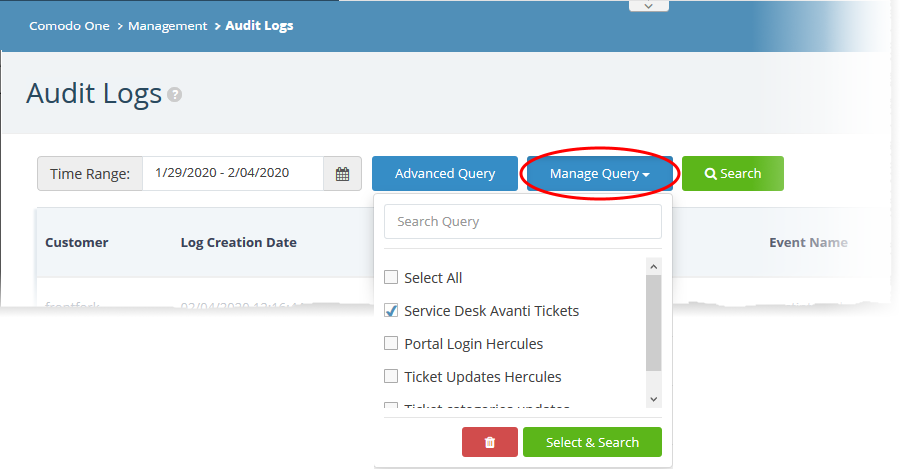
- Click 'Select & Search'
The logs are filtered to show only those matching your query.
You can export logs to a comma-separated value (CSV) file for later analysis and troubleshooting.
- Apply any filters you require to the list first
- Click the 'Export to CSV' button.
.csv files are best viewed in spreadsheet applications like Microsoft Excel and OpenOffice Calc.
Further reading - Other types of logs
You can view Endpoint Manager logs at 'Endpoint Manager' > 'Dashboard' > 'Audit Logs'
- See How to view logs of admin/staff actions in Endpoint Manager if you need help with this.
You can view logs about a specific Endpoint Manager device from its 'Details' interface.
- See How to view logs about a specific Windows device in Endpoint Manager if you need help with this.


---